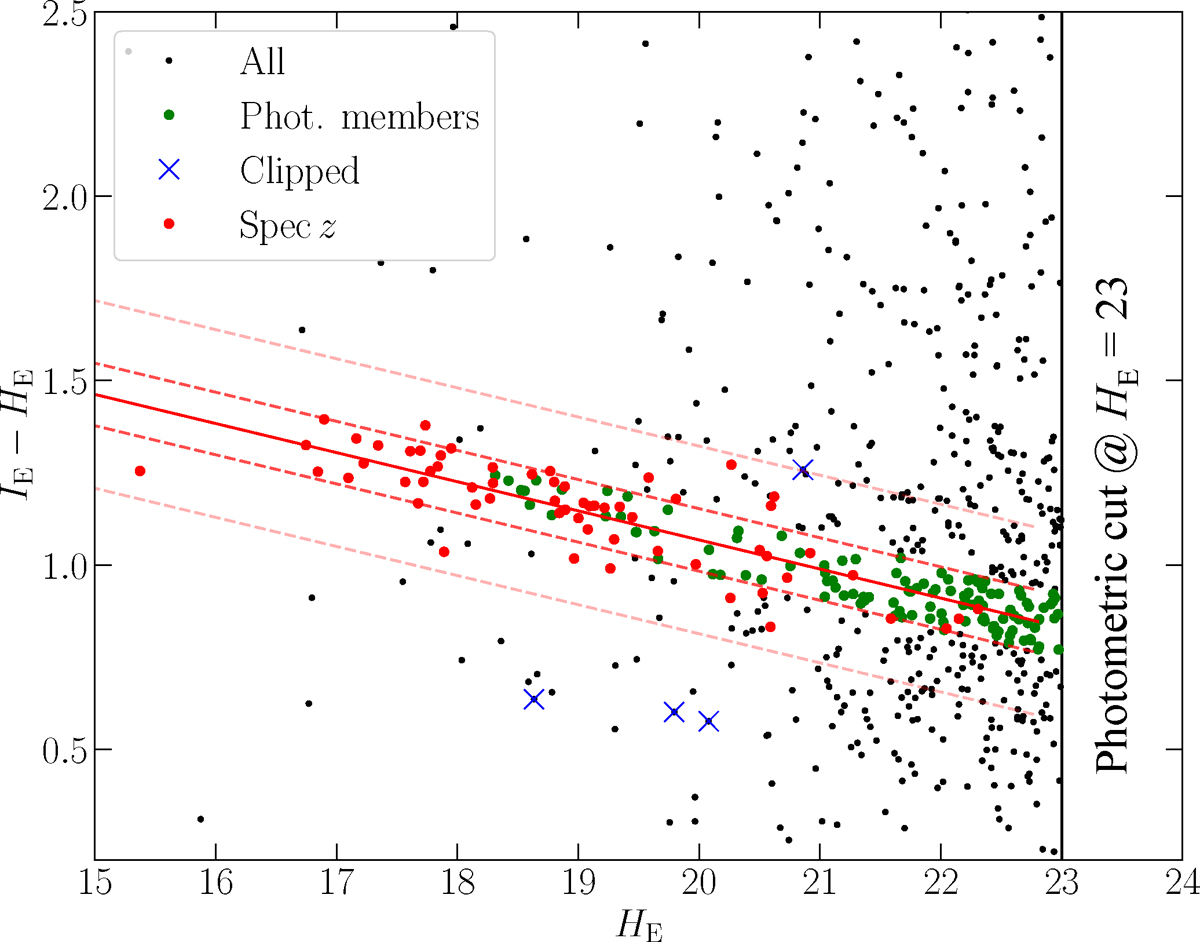
Fig. 4.
Download original image
Colour-magnitude IE − HE vs HE diagram. The red dots represent the 60 spectroscopically confirmed cluster members that we employed to fit the RCS, whereas the four cluster members we discarded due to the clipping are in blue. The green dots are the photometric galaxies added to our cluster member sample. The solid red line is the best-fit RCS, while the dotted ones define a range of ±σRCS (used for the selection of the cluster members) and ±3σRCS (used for the clipping) around the line, respectively.
Current usage metrics show cumulative count of Article Views (full-text article views including HTML views, PDF and ePub downloads, according to the available data) and Abstracts Views on Vision4Press platform.
Data correspond to usage on the plateform after 2015. The current usage metrics is available 48-96 hours after online publication and is updated daily on week days.
Initial download of the metrics may take a while.