Fig. 5.
Download original image
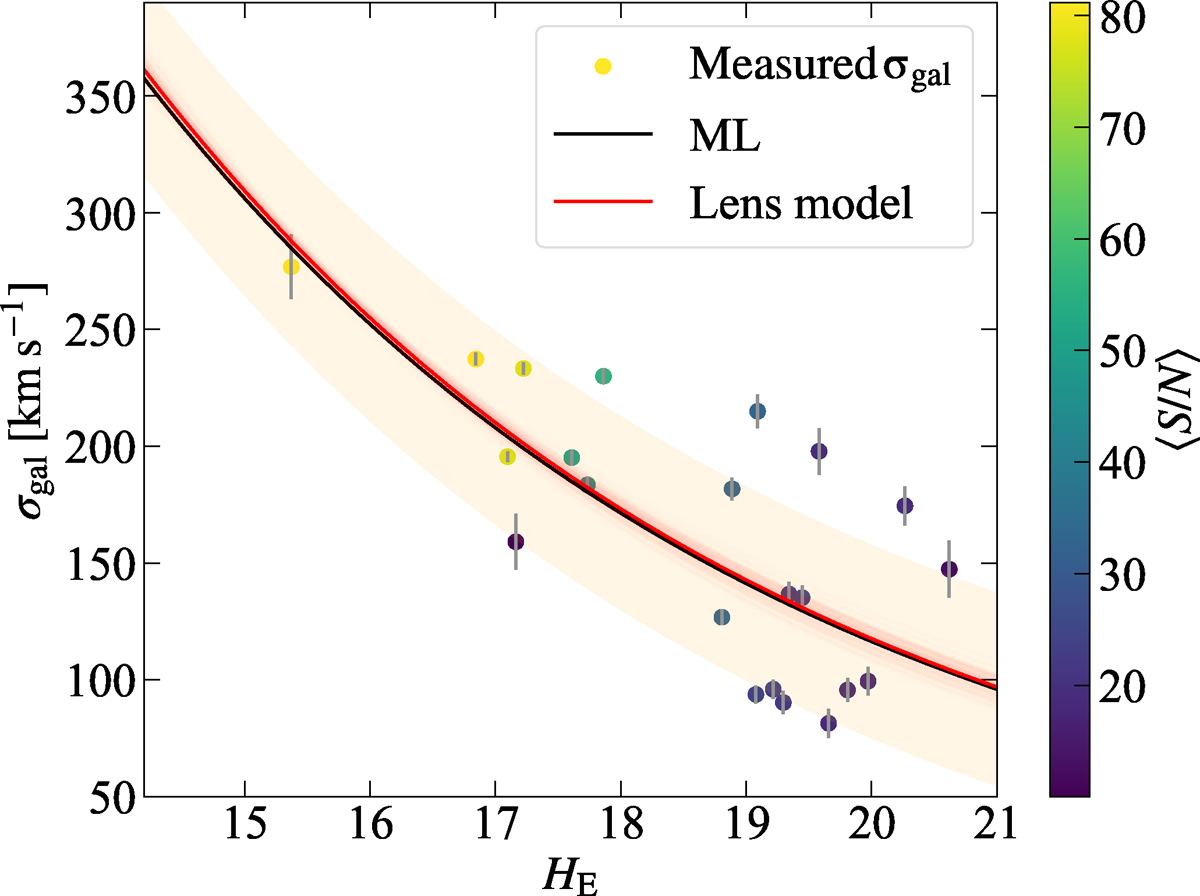
Measured stellar velocity dispersions of 22 MUSE spectroscopically confirmed cluster members as a function of their EuclidHE magnitudes. Their colours encode the mean signal-to-noise ratio of galaxy spectra. The black solid line is the best-fit (maximum likelihood) of the scaling relation in Eq. (9). The light orange band corresponds to the best-fit mean scatter, Δσap, around the best-fit relation. The red solid curve corresponds to the relation in Eq. (9) as obtained with the best-fit parameters of our reference model (see Sect. 3.1). The light red area is estimated from 300 random values of σref extracted from the Bayesian MCMC realisations of the reference model of this work.
Current usage metrics show cumulative count of Article Views (full-text article views including HTML views, PDF and ePub downloads, according to the available data) and Abstracts Views on Vision4Press platform.
Data correspond to usage on the plateform after 2015. The current usage metrics is available 48-96 hours after online publication and is updated daily on week days.
Initial download of the metrics may take a while.