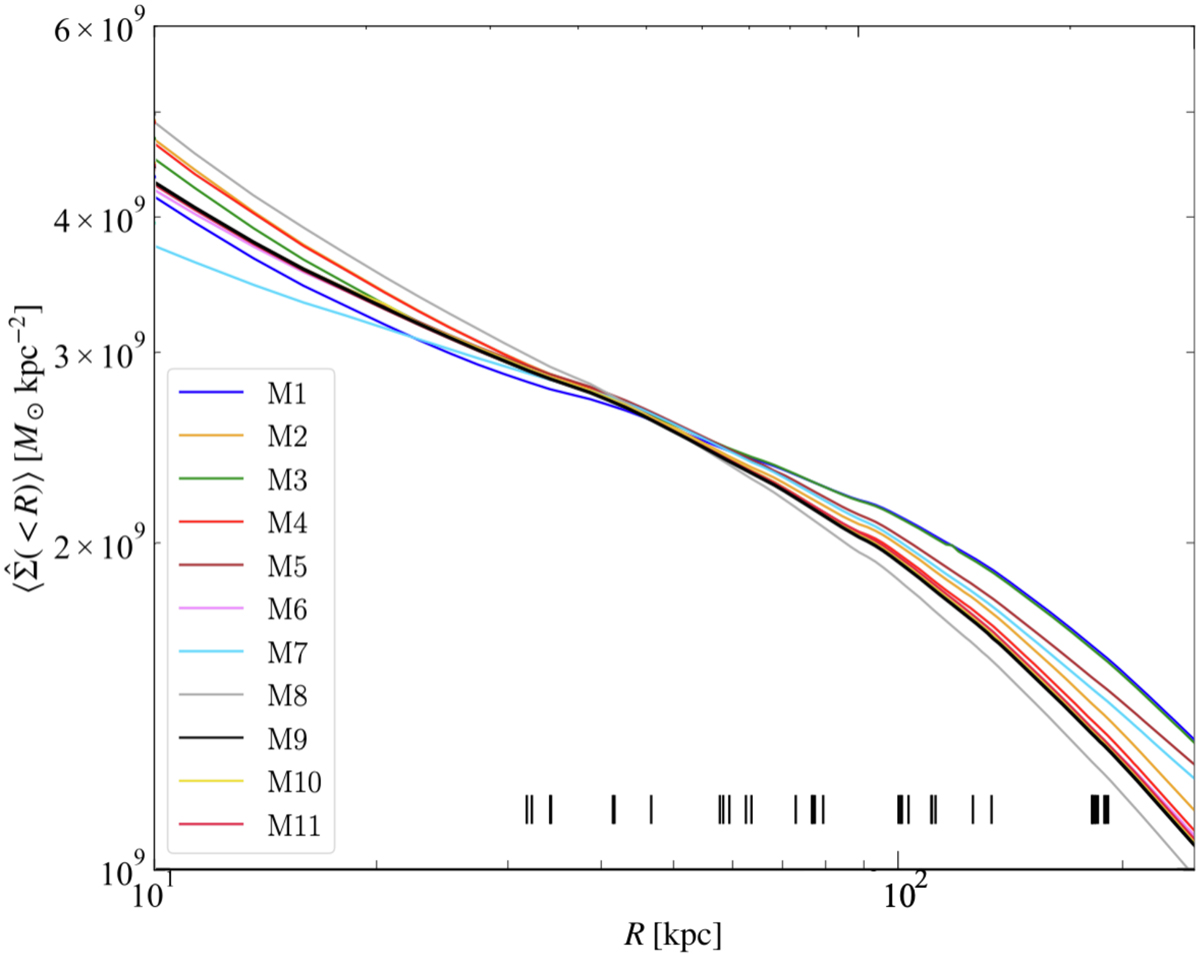
Fig. 7.
Download original image
Average cumulative projected total surface mass density profile of A2390 from the reference (M9, in black) and the other models explored as a function of the projected distance from the BCG. The vertical black lines in the bottom part of the plot are the projected distances from the BCG of the 35 multiple images included in our models.
Current usage metrics show cumulative count of Article Views (full-text article views including HTML views, PDF and ePub downloads, according to the available data) and Abstracts Views on Vision4Press platform.
Data correspond to usage on the plateform after 2015. The current usage metrics is available 48-96 hours after online publication and is updated daily on week days.
Initial download of the metrics may take a while.