Open Access
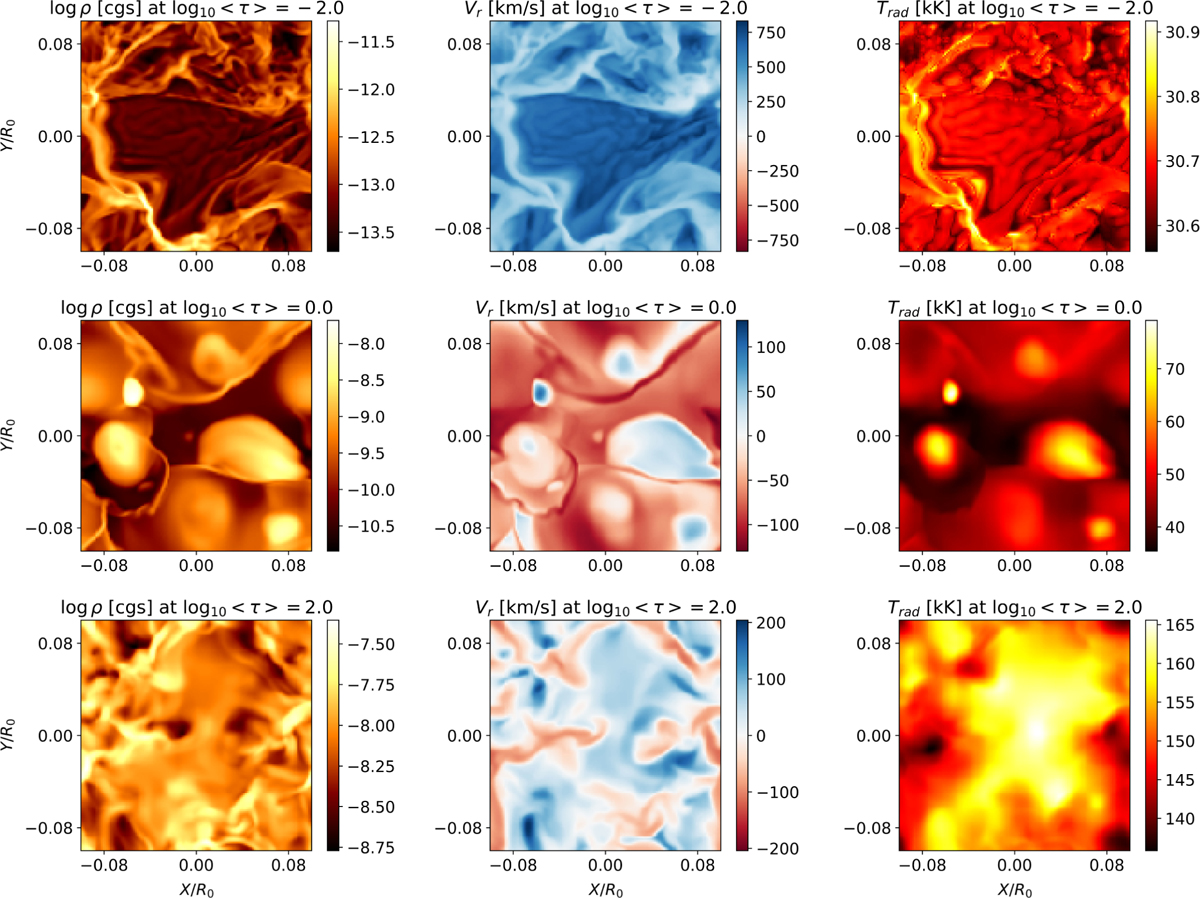
Fig. 2
Download original image
Maps of logarithm of density, radial velocity, and radiation temperature, in three selected vertical planes with laterally averaged continuum optical depth according to the legends. The lateral X and Y axes are labelled in units of R0.
Current usage metrics show cumulative count of Article Views (full-text article views including HTML views, PDF and ePub downloads, according to the available data) and Abstracts Views on Vision4Press platform.
Data correspond to usage on the plateform after 2015. The current usage metrics is available 48-96 hours after online publication and is updated daily on week days.
Initial download of the metrics may take a while.