Fig. 3
Download original image
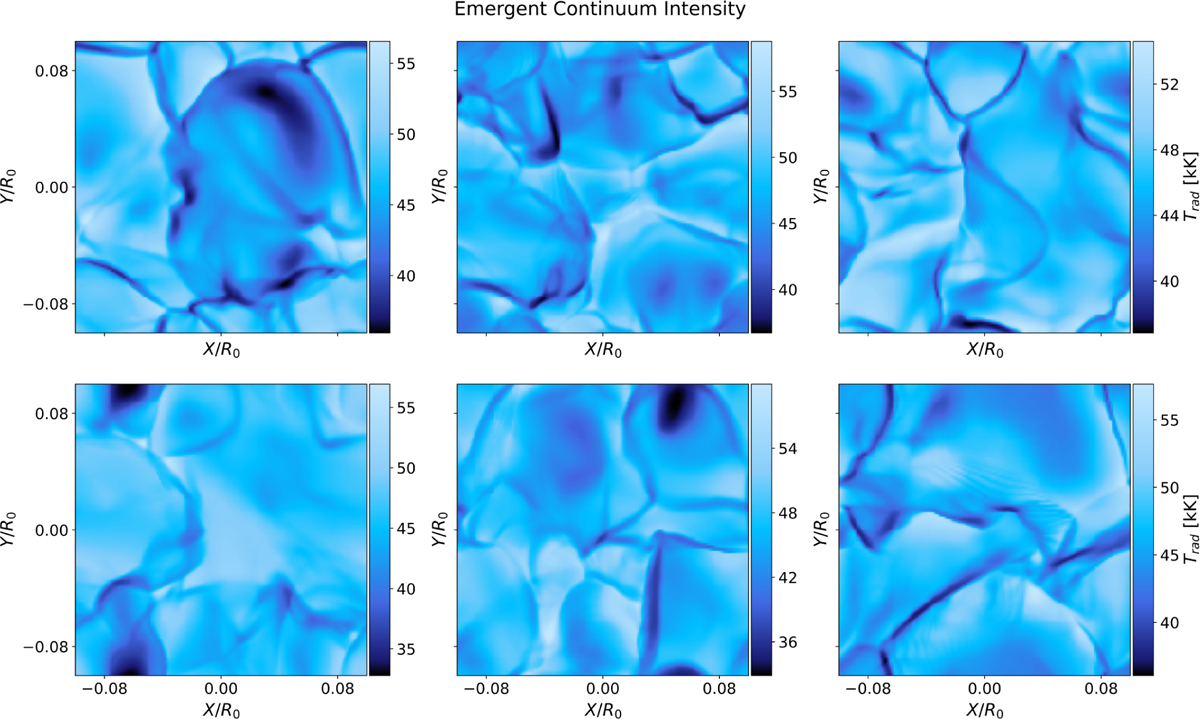
Emergent optical continuum intensities of local patches on the 3D O star model, for six different snapshots. Each panel here corresponds to one μ=1 (local surface normal and line of sight are aligned) 3D patch simulation, and is showing the complete patch. Colour bars display local emergent radiation temperature defined through Iν ≡ Bν(Trad). The spatial extent of each X and Y axis is 0.2 R0.
Current usage metrics show cumulative count of Article Views (full-text article views including HTML views, PDF and ePub downloads, according to the available data) and Abstracts Views on Vision4Press platform.
Data correspond to usage on the plateform after 2015. The current usage metrics is available 48-96 hours after online publication and is updated daily on week days.
Initial download of the metrics may take a while.