Open Access
Fig. 7
Download original image
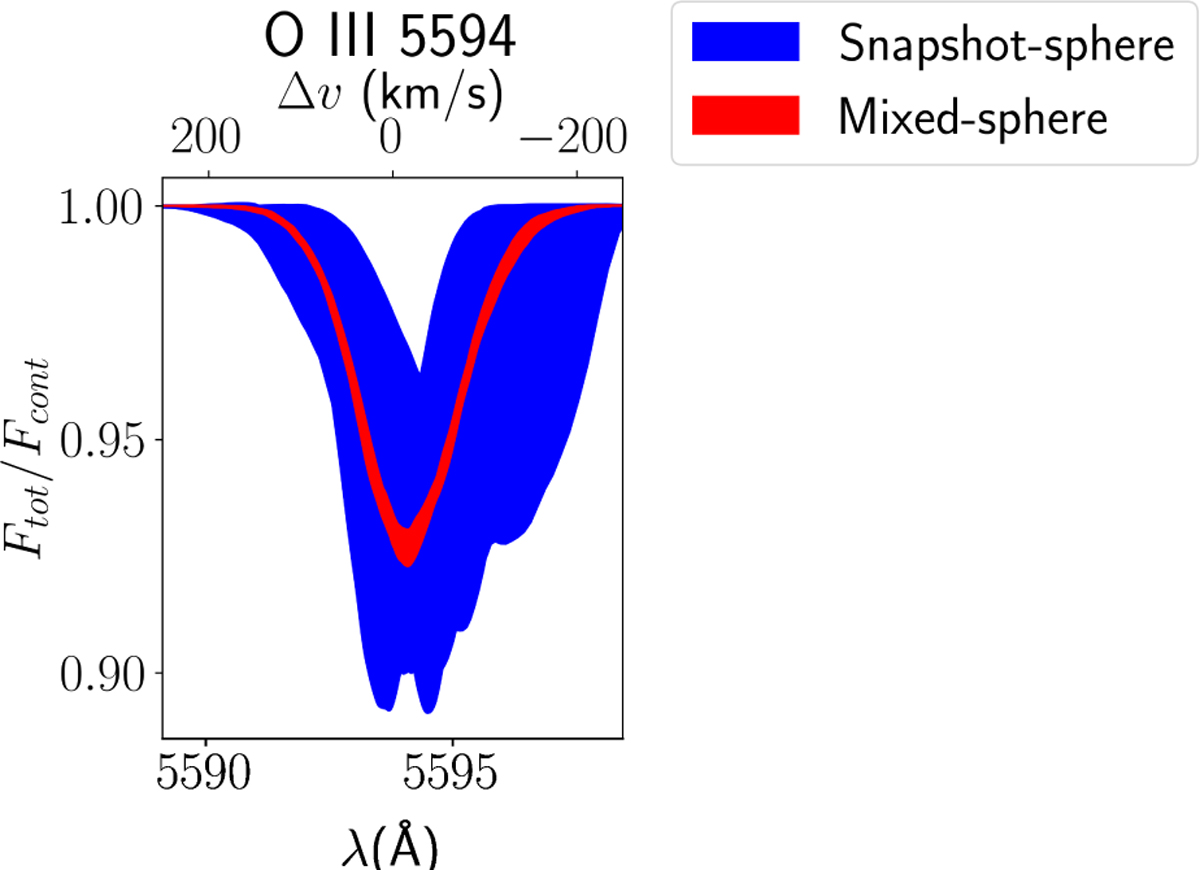
Coloured-in regions showing variability for the O III 5594 Å line. The blue corresponds to the variability of the snapshot-sphere models (65 models in total), while the red corresponds to the variability of the mixed-sphere models (20 models in total).
Current usage metrics show cumulative count of Article Views (full-text article views including HTML views, PDF and ePub downloads, according to the available data) and Abstracts Views on Vision4Press platform.
Data correspond to usage on the plateform after 2015. The current usage metrics is available 48-96 hours after online publication and is updated daily on week days.
Initial download of the metrics may take a while.