Fig. 8
Download original image
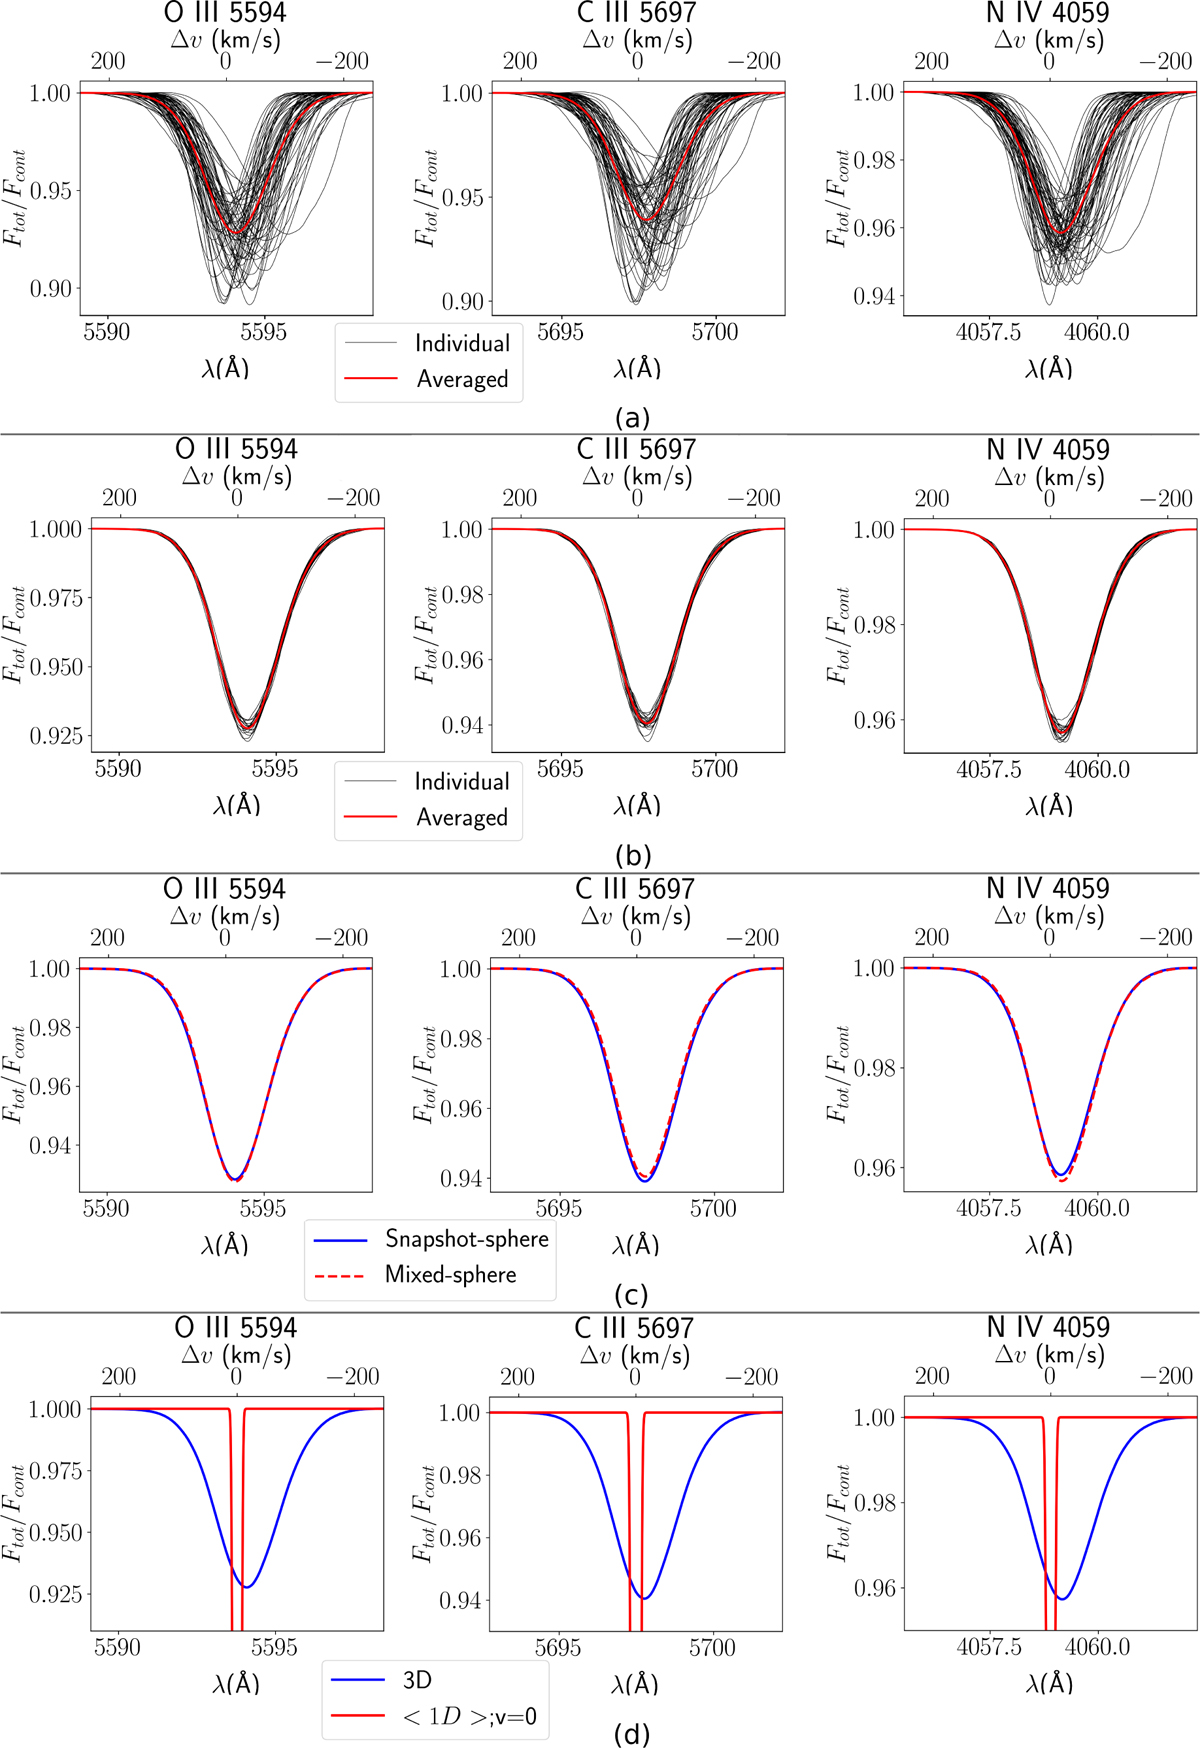
O III 5594 Å line, the C III 5697 Å line and the N IV 4059 Å line for the 3D O-star simulation, (a) using 65 snapshot-sphere models (the red lines show the result when all lines are averaged), (b) using mixed-sphere models (the red lines show the result when all lines are averaged), (c) showing averaged lines from both the snapshot-spheres (blue line) and mixed spheres (red line) and (d) showing averaged lines for the mixed-sphere models for both the ‘3D’ (unaltered) models and the 1D averaged, velocity-field-turned-off models.
Current usage metrics show cumulative count of Article Views (full-text article views including HTML views, PDF and ePub downloads, according to the available data) and Abstracts Views on Vision4Press platform.
Data correspond to usage on the plateform after 2015. The current usage metrics is available 48-96 hours after online publication and is updated daily on week days.
Initial download of the metrics may take a while.