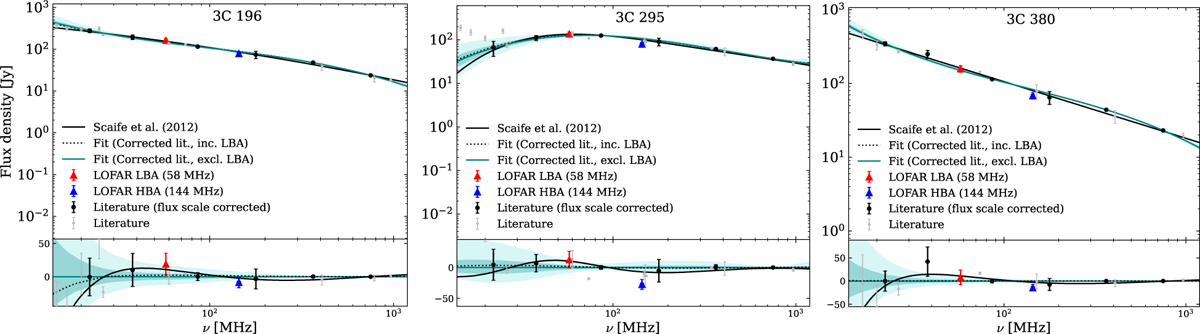
Fig. 4
Download original image
Top panels: synchrotron spectrum of the calibrators. The red triangle indicates our LOFAR LBA measurement with an added illustrative uncertainty of 10%, and the circle indicates the entries queried from NED. Only the black dots were scaled to the SH flux scale, gray points are not. The blue line through the black points shows the fitted MCMC spectrum, and the dotted black line shows the fitted spectrum using all scaled literature values, including LBA. The blue line shows our fit with 1σ and 2σ model uncertainties. The fit was performed on the literature values with flux-scale-corrected fluxes and fluxes at frequencies >1 GHz. Bottom panels: residual of the three fits in linear space.
Current usage metrics show cumulative count of Article Views (full-text article views including HTML views, PDF and ePub downloads, according to the available data) and Abstracts Views on Vision4Press platform.
Data correspond to usage on the plateform after 2015. The current usage metrics is available 48-96 hours after online publication and is updated daily on week days.
Initial download of the metrics may take a while.