Open Access
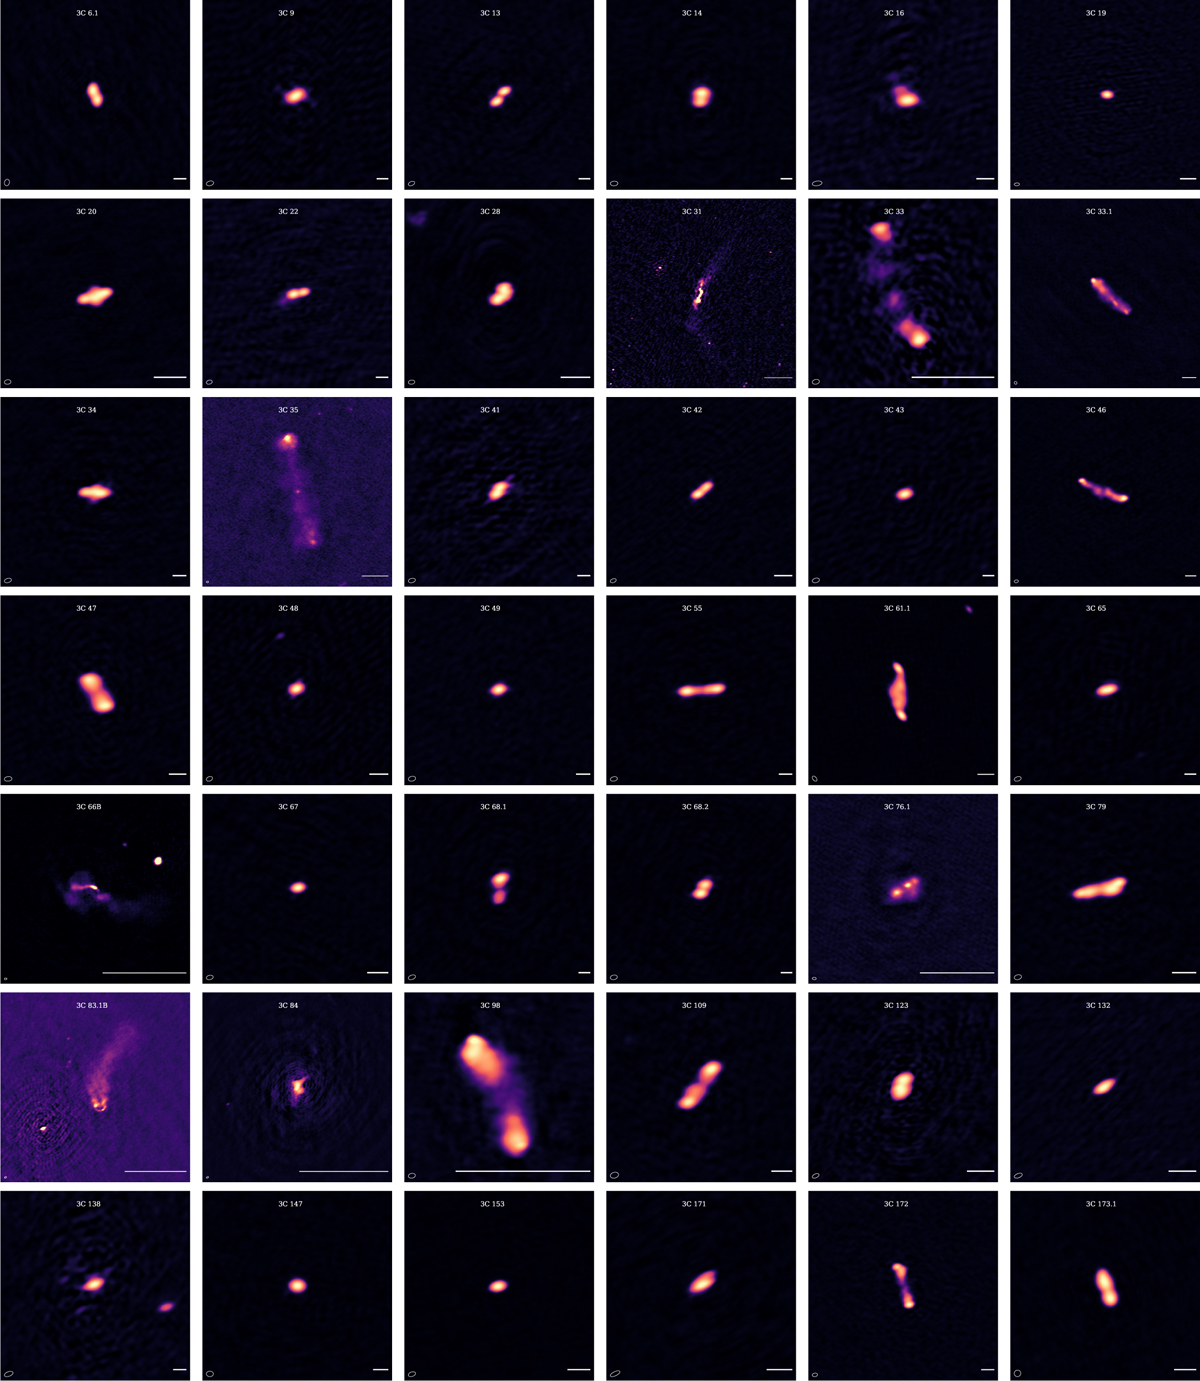
Fig. A.1
Download original image
Radio maps of 3C sources. The color map is not indicated and varies depending on the surface brightness of the source. The beam is indicated for each map. The physical scale bar denotes 200 kpc with the exception of 3C 231 and 3C 272.1 (10 kpc), and 3C 274 and 3C 386 (100kpc).
This figure is made of several images, please see below:


Current usage metrics show cumulative count of Article Views (full-text article views including HTML views, PDF and ePub downloads, according to the available data) and Abstracts Views on Vision4Press platform.
Data correspond to usage on the plateform after 2015. The current usage metrics is available 48-96 hours after online publication and is updated daily on week days.
Initial download of the metrics may take a while.