Fig. 3.
Download original image
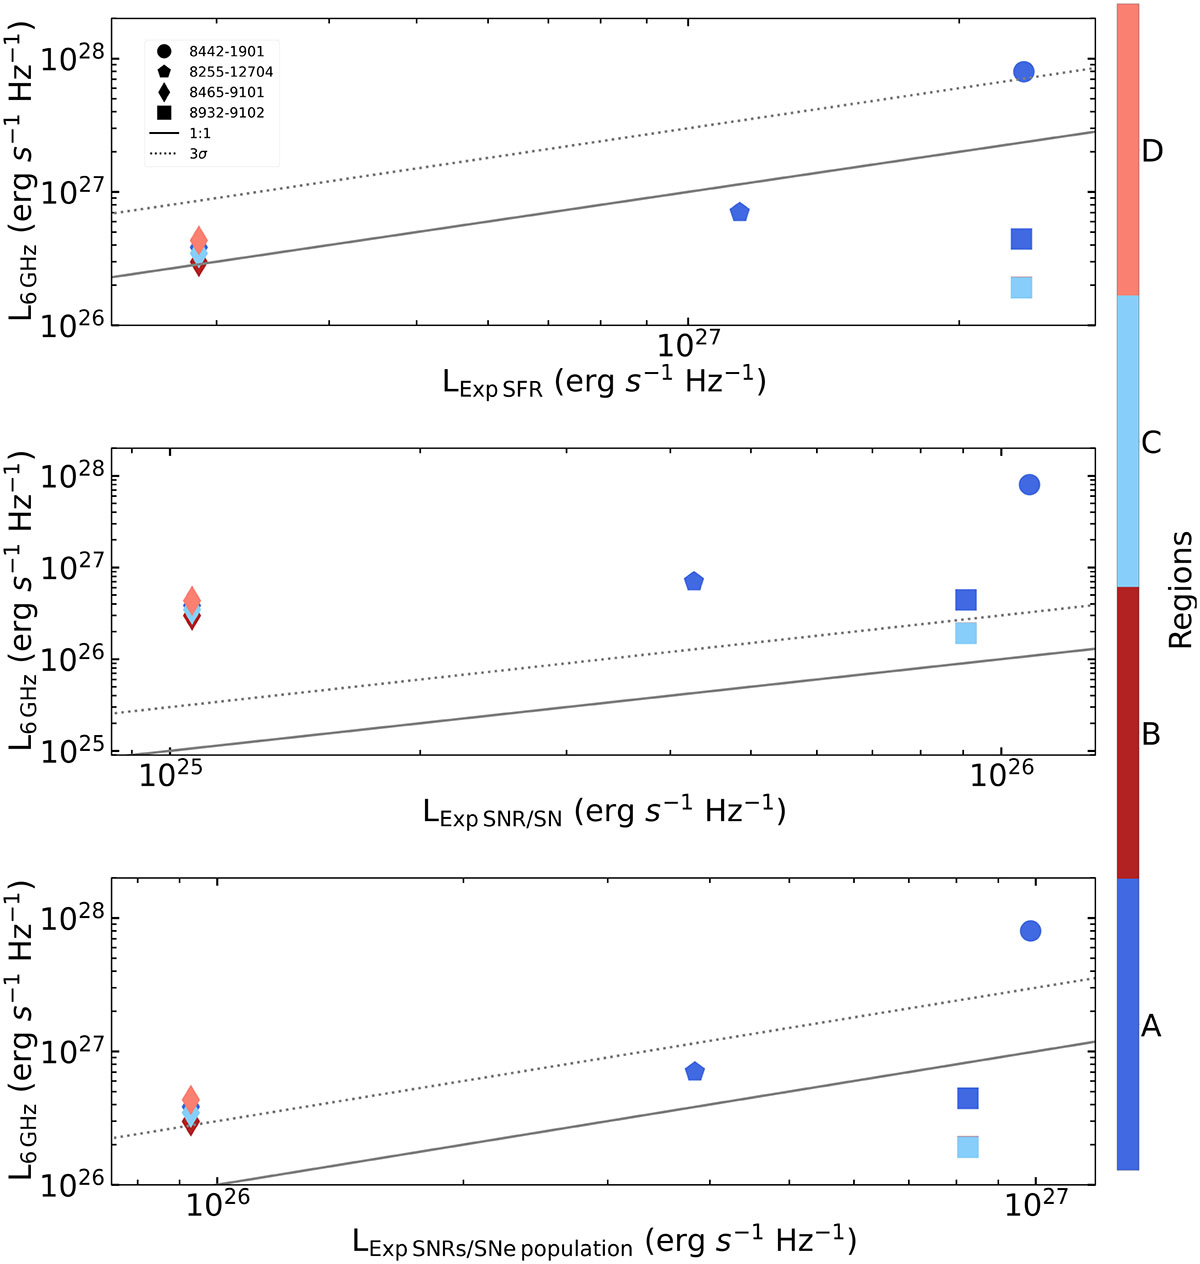
Possible origin of the radio emission detected in our sample of MaNGA AGN candidates. The grey solid line represents the one-to-one relation of the expected luminosity of each possible origin. The grey dotted line represents the luminosity 3σ above the expected luminosity for each possible origin. Unseen error bars are smaller than the size of the plotted symbols. Top: Under the assumption that the radio emission is thermal bremsstrahlung (i.e., the origin of the emission is star formation), the 6 GHz luminosity density of our sources versus the expected luminosity of the star formation has been plotted. Middle: 6 GHz luminosity densities of our sources versus the expected luminosity of individual SNR-SN. Bottom: 6 GHz luminosity densities of our sources versus the expected cumulative luminosity of the SNRs-SNe population. Sources above the 3σ expected luminosity cannot be explained by the specific mechanism since individual regions cannot have luminosities that exceed what is expected for each mechanism in the entire galaxy. Sources below this region can have their origin in each specific mechanism.
Current usage metrics show cumulative count of Article Views (full-text article views including HTML views, PDF and ePub downloads, according to the available data) and Abstracts Views on Vision4Press platform.
Data correspond to usage on the plateform after 2015. The current usage metrics is available 48-96 hours after online publication and is updated daily on week days.
Initial download of the metrics may take a while.