Fig. 5
Download original image
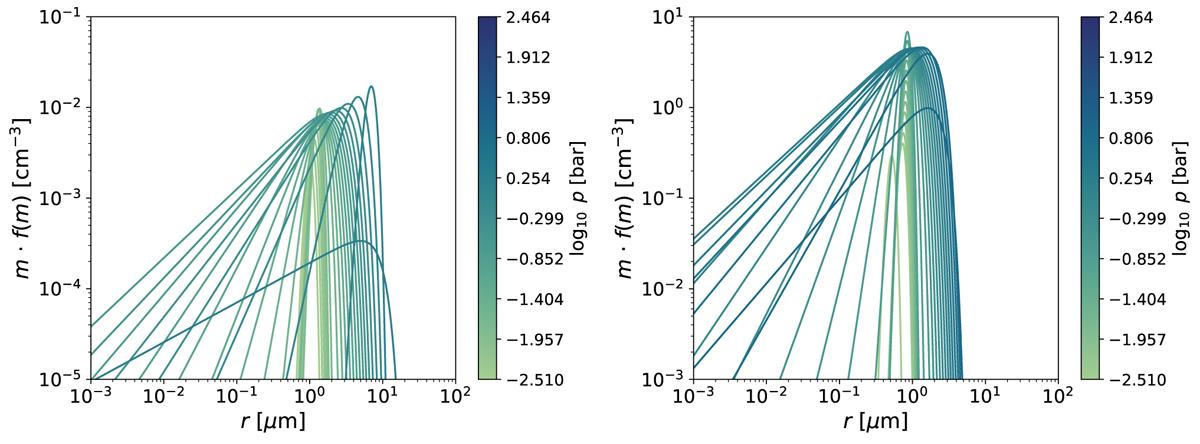
Reconstructed gamma particle size distributions from the simulations performed in Section 5 for the log g = 3.25 (left) and log g = 4.25 (right) cases. This shows the size distribution properties with pressure (colour bar) in the atmosphere. In general, the size distribution narrows with decreasing pressure, with the most broad distributions occurring near the cloud base.
Current usage metrics show cumulative count of Article Views (full-text article views including HTML views, PDF and ePub downloads, according to the available data) and Abstracts Views on Vision4Press platform.
Data correspond to usage on the plateform after 2015. The current usage metrics is available 48-96 hours after online publication and is updated daily on week days.
Initial download of the metrics may take a while.