Fig. 10.
Download original image
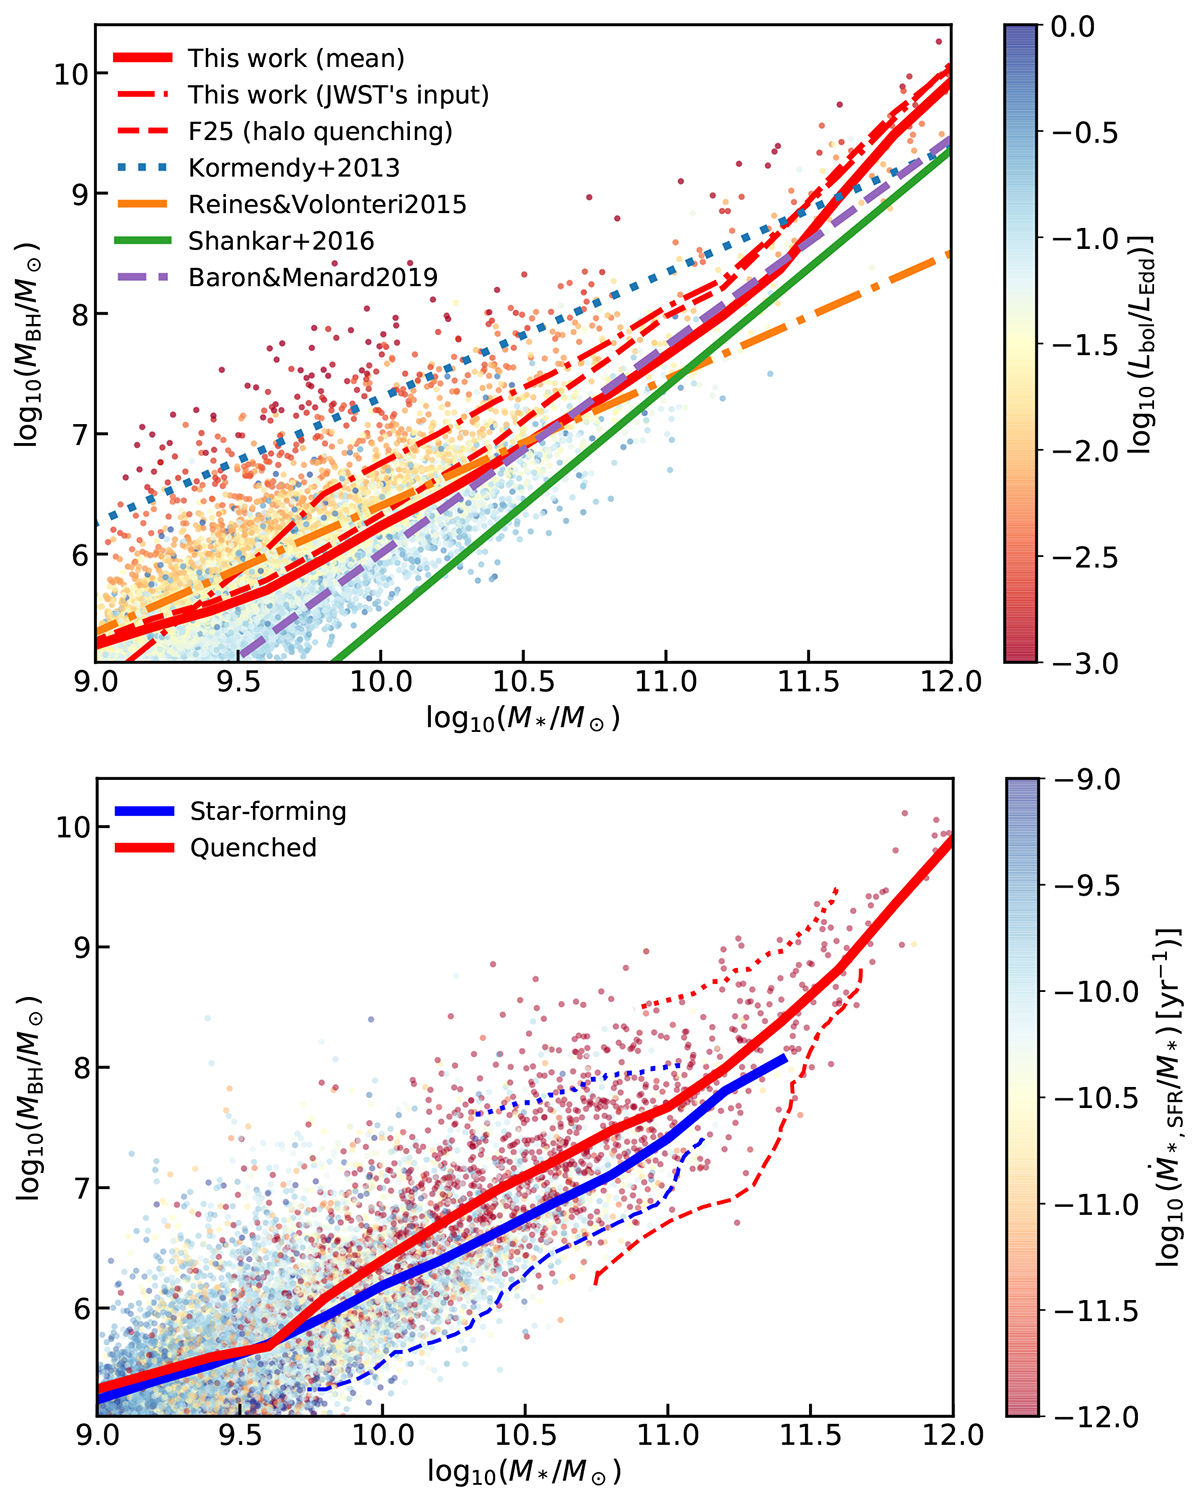
Upper panel: Local black hole mass-stellar mass relation predicted by DECODE colour-coded with the Lbol/LEdd ratio. The red solid and dashed lines depict the mean relations from DECODE for the black hole quenching (this work) and halo quenching (F25) scenarios, respectively. The red dash-dotted line show the case of adopting the JWST Pacucci et al. (2023)MBH − M★ seeding. DECODE’s results are compared to the observationally measured relations from Kormendy & Ho (2013, blue dotted line), Reines & Volonteri (2015, orange dash-dotted line), Shankar et al. (2016, green solid line and shaded area) and Baron & Ménard (2019, purple dashed line). Lower panel: Same as upper panel, but colour-coded with the galaxy specific star formation rate. The blue and red dashed lines show the average mass evolution of black holes selected in star-forming galaxies with stellar mass 1011 M⊙ < M★ < 1011.2 M⊙ and quenched galaxies with stellar mass M★ > 1011.5 M⊙, respectively, approaching the mean relation from below. The blue and red dotted lines show the same quantity but for black holes approaching the mean relation from above.
Current usage metrics show cumulative count of Article Views (full-text article views including HTML views, PDF and ePub downloads, according to the available data) and Abstracts Views on Vision4Press platform.
Data correspond to usage on the plateform after 2015. The current usage metrics is available 48-96 hours after online publication and is updated daily on week days.
Initial download of the metrics may take a while.