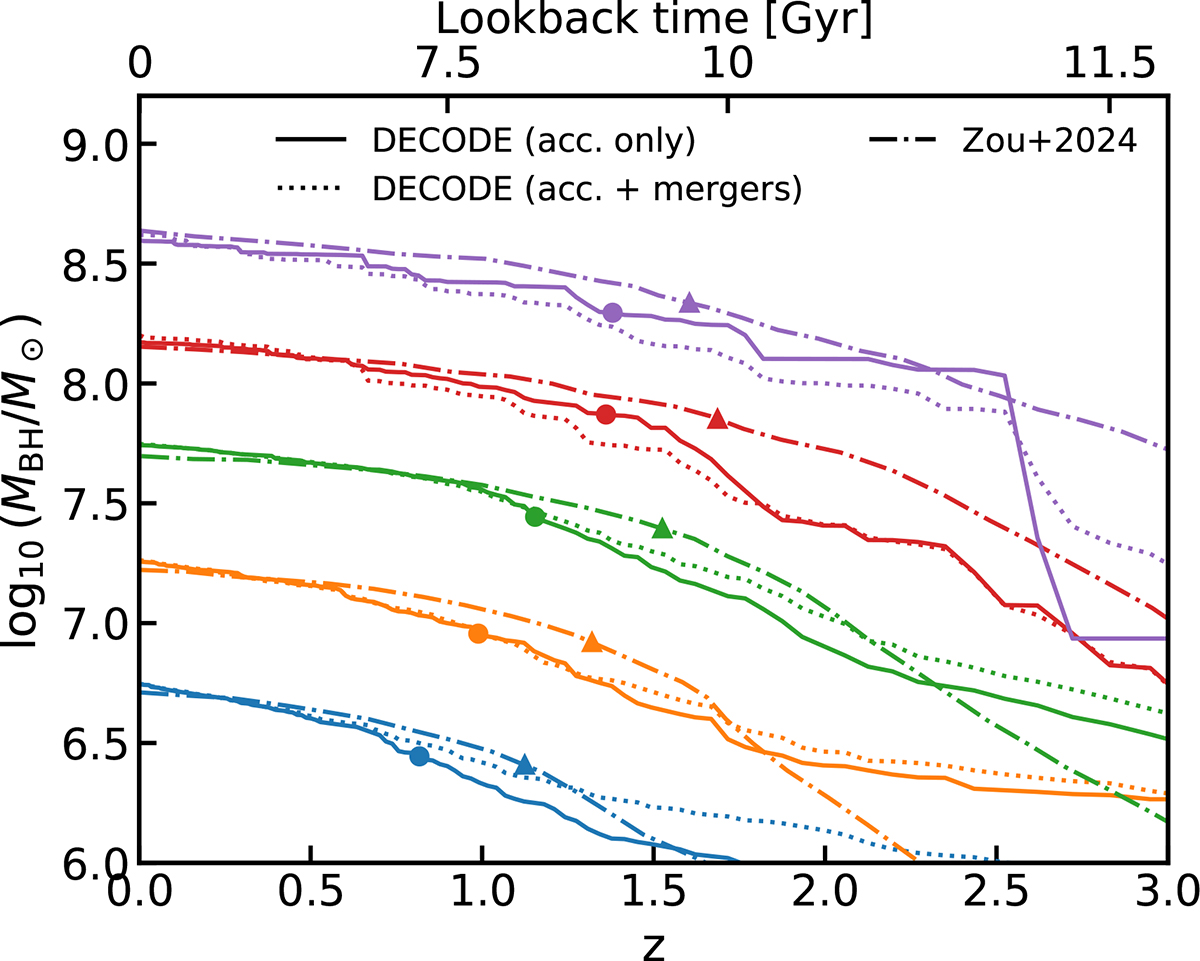
Fig. 4.
Download original image
Average black hole mass accretion histories as predicted from DECODE, compared to those predicted from Zou et al. (2024a, dash-dotted lines). DECODE’s results are shown both for the accretion-only scenario (solid lines) and the scenario with mergers (dotted lines). The filled circles and triangles show the redshift at which half of the black hole mass is formed. The different colours show the accretion tracks for different black mass bins at z = 0: log10(MBH/M⊙)≃6.75 (blue lines), log10(MBH/M⊙)≃7.25 (orange lines), log10(MBH/M⊙)≃7.75 (green lines), log10(MBH/M⊙)≃8.2 (red lines), and log10(MBH/M⊙)≃8.6 (purple lines).
Current usage metrics show cumulative count of Article Views (full-text article views including HTML views, PDF and ePub downloads, according to the available data) and Abstracts Views on Vision4Press platform.
Data correspond to usage on the plateform after 2015. The current usage metrics is available 48-96 hours after online publication and is updated daily on week days.
Initial download of the metrics may take a while.