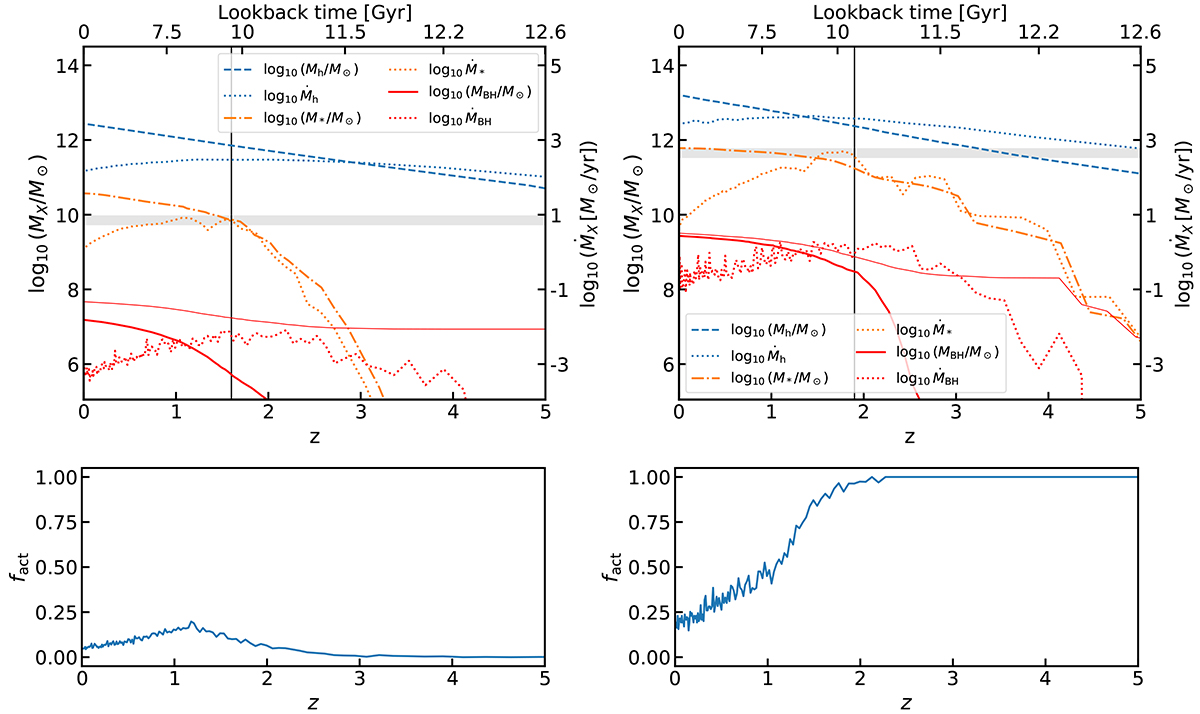
Fig. 6.
Download original image
Upper panels: Mean evolution of galaxies in our catalogue selected with stellar mass of M★ ≃ 1010.5 M⊙ (left) and M★ > 1011.5 M⊙ (right) at redshift z = 0 from DECODE’s catalogue. The blue dashed and dotted lines show the host dark matter halo mass assembly history and accretion rate. The orange dash-dotted and dotted lines show the galaxy stellar mass growth and star formation rate, respectively. The red solid and dotted lines show the black hole mass assembly and accretion rate, respectively. The thin red solid lines show the case where we use the JWST Pacucci et al. (2023) relation to seed the SMBHs. The left-hand side y-axis refers to the mass growth values and the right-hand side y-axis refers to the accretion rate values. The horizontal shaded area shows the MBH − σ★ quenching threshold with the 0.3 dex dispersion. The vertical black line shows the redshift at which the host halo reached the golden halo mass Mh ∼ 1012 M⊙. Lower panels: Fraction of AGNs as a function of redshift for the same galaxy stellar mass bin as in the upper panel.
Current usage metrics show cumulative count of Article Views (full-text article views including HTML views, PDF and ePub downloads, according to the available data) and Abstracts Views on Vision4Press platform.
Data correspond to usage on the plateform after 2015. The current usage metrics is available 48-96 hours after online publication and is updated daily on week days.
Initial download of the metrics may take a while.