Fig. 9.
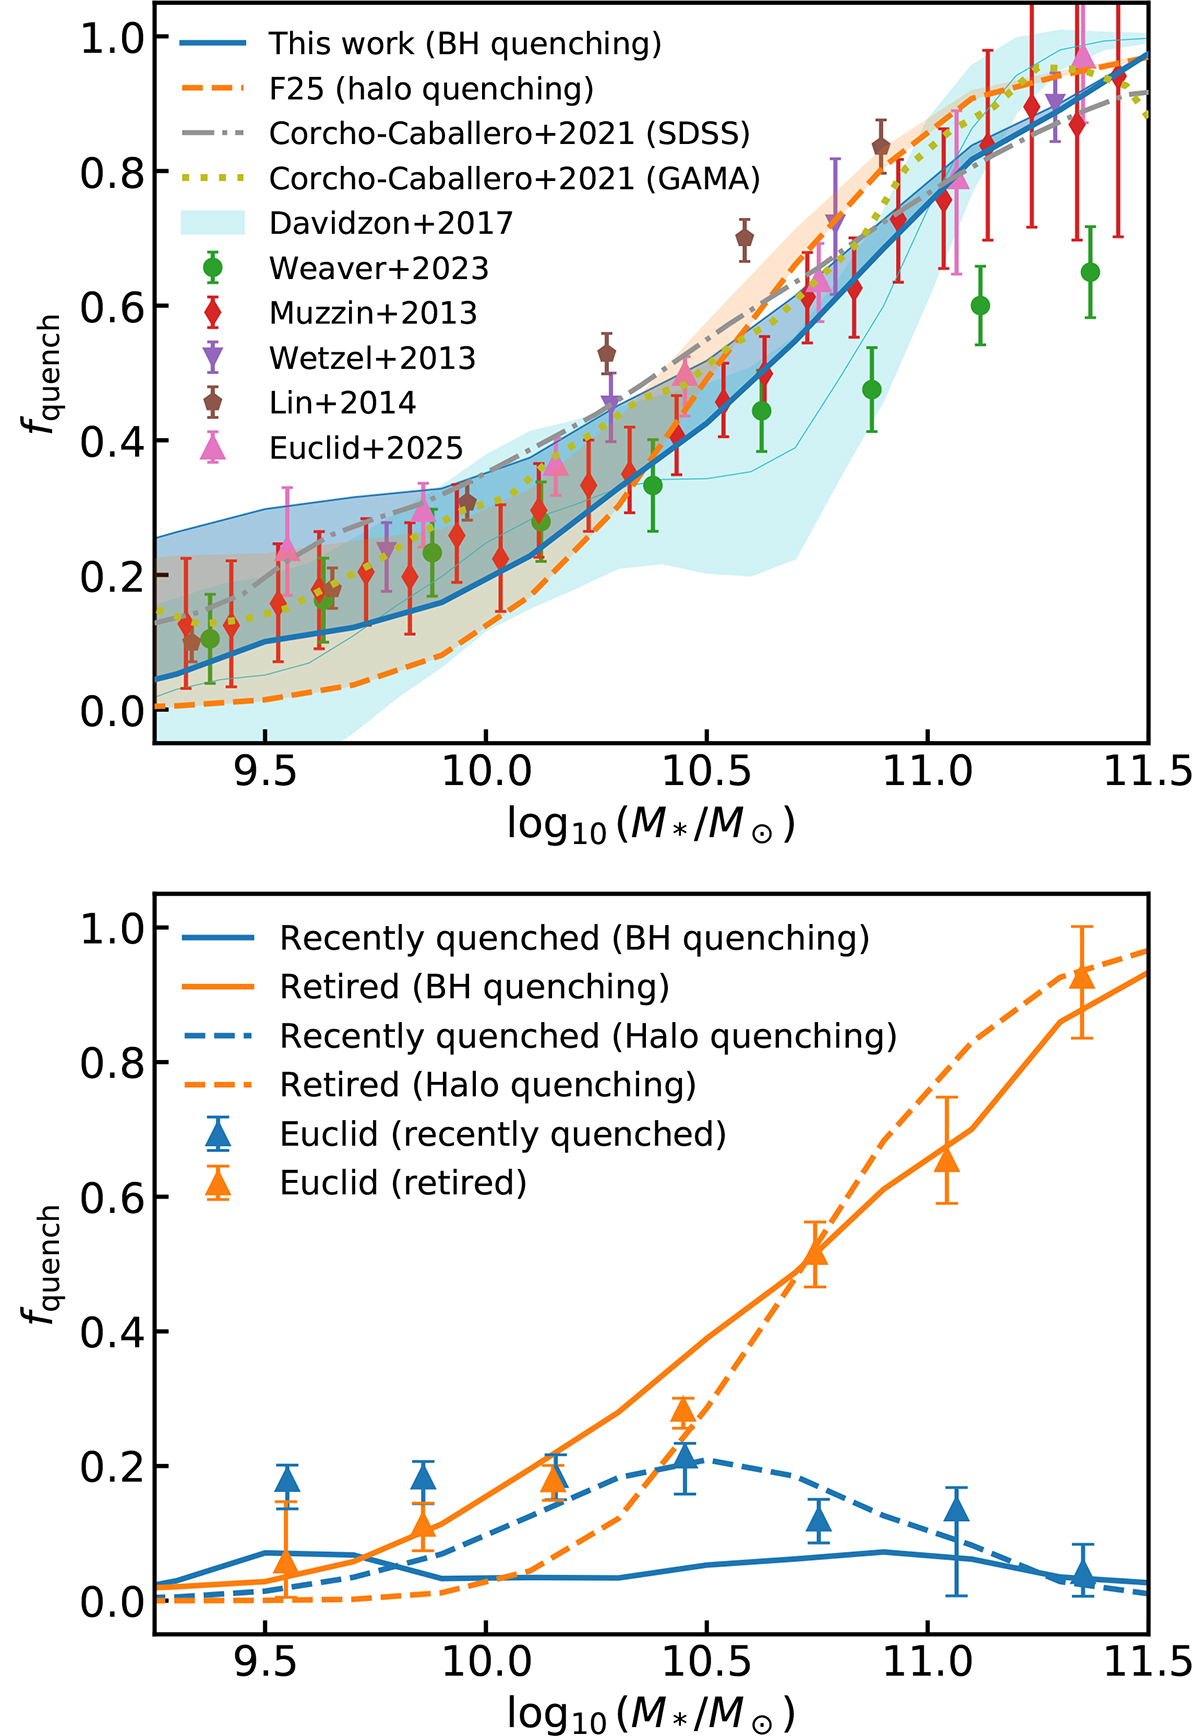
Download original image
Upper panel: Fraction of quenched galaxies as a function of stellar mass at redshift z = 0. Blue solid and orange dashed lines show the black hole and halo quenching scenarios, respectively. The blue and orange thin lines and shaded areas denote the upper bound and uncertainty in the extreme assumption of all satellites being quenched. We compare DECODE’s predictions to the observed quenched fractions from SDSS/GAMA (grey dash-dotted and yellow dotted lines; Corcho-Caballero et al. 2021), COSMOS2015 (cyan solid lines and shaded areas; Davidzon et al. 2017), COSMOS2020 (green dots with error bars; Weaver et al. 2023), Muzzin et al. (2013) (red rhombuses with error bars), Wetzel et al. (2013) (purple triangles with error bars), Lin et al. (2014) (brown pentagons with error bars) and Euclid (pink triangles with error bars; Euclid Collaboration: Corcho-Caballero et al. 2025). Lower panel: Same as upper panel, but divided into recently quenched (blue lines and triangles) and retired (orange lines and triangles) galaxies. We compare our results to the fraction of quenched and retired galaxies from the Euclid Q1 data release (Euclid Collaboration: Corcho-Caballero et al. 2025).
Current usage metrics show cumulative count of Article Views (full-text article views including HTML views, PDF and ePub downloads, according to the available data) and Abstracts Views on Vision4Press platform.
Data correspond to usage on the plateform after 2015. The current usage metrics is available 48-96 hours after online publication and is updated daily on week days.
Initial download of the metrics may take a while.