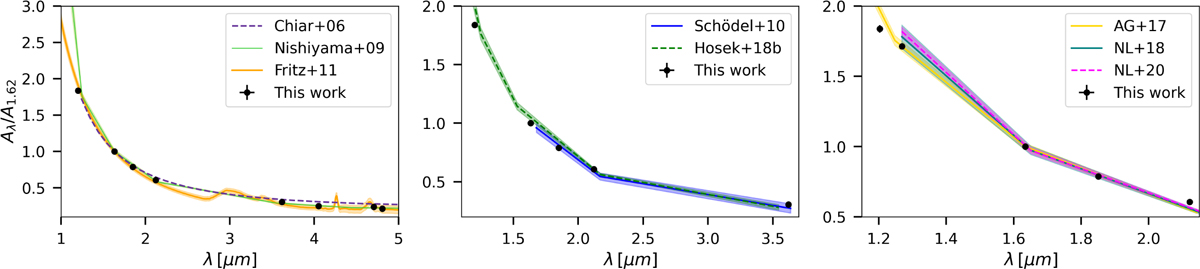
Fig. 6
Download original image
Extinction curve derived in this work compared with previous results from the literature. Left: Chiar & Tielens (2006), Nishiyama et al. (2009), and Fritz et al. (2011). Centre: Schödel et al. (2010) and Hosek et al. (2019). Right: Alonso-García et al. (2017), Nogueras-Lara et al. (2018), and Nogueras-Lara et al. (2020). In all cases we translated the extinction curves from the literature to our reference filter system. For the centre and right panels, the J-band extinction value and its uncertainty were obtained by interpolating our extinction curve. Uncertainties are not available for Chiar & Tielens (2006) and are therefore not shown.
Current usage metrics show cumulative count of Article Views (full-text article views including HTML views, PDF and ePub downloads, according to the available data) and Abstracts Views on Vision4Press platform.
Data correspond to usage on the plateform after 2015. The current usage metrics is available 48-96 hours after online publication and is updated daily on week days.
Initial download of the metrics may take a while.