Open Access
Fig. 1
Download original image
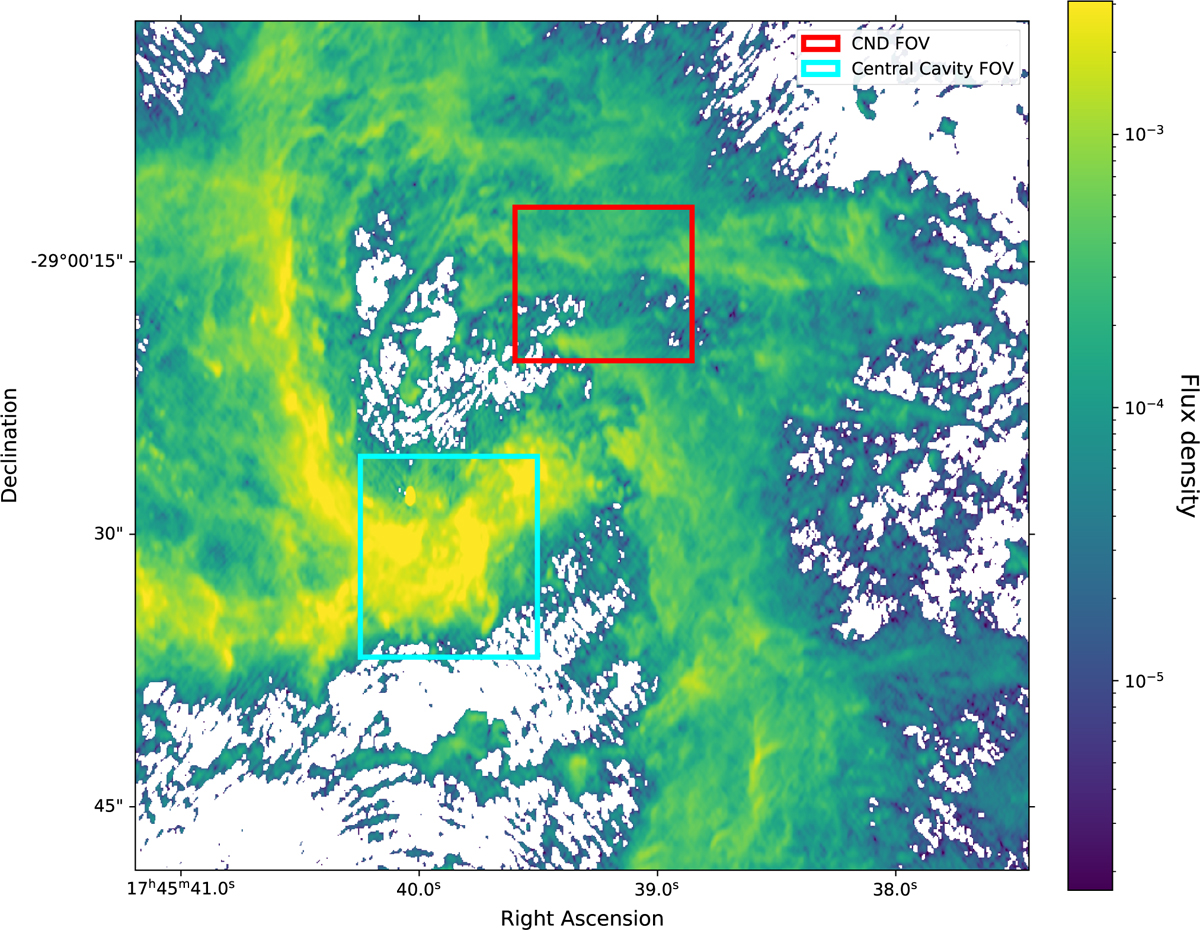
Overview of the GC with the JWST/MIRI-MRS pointings overlaid. The background image is a VLA 2 cm radio map (Morris et al. 2017) showing the ionized gas structures in the central few parsecs. The cyan rectangle outlines the CC pointing, and the red rectangle shows the footprint of the CND pointing.
Current usage metrics show cumulative count of Article Views (full-text article views including HTML views, PDF and ePub downloads, according to the available data) and Abstracts Views on Vision4Press platform.
Data correspond to usage on the plateform after 2015. The current usage metrics is available 48-96 hours after online publication and is updated daily on week days.
Initial download of the metrics may take a while.