Fig. A.1
Download original image
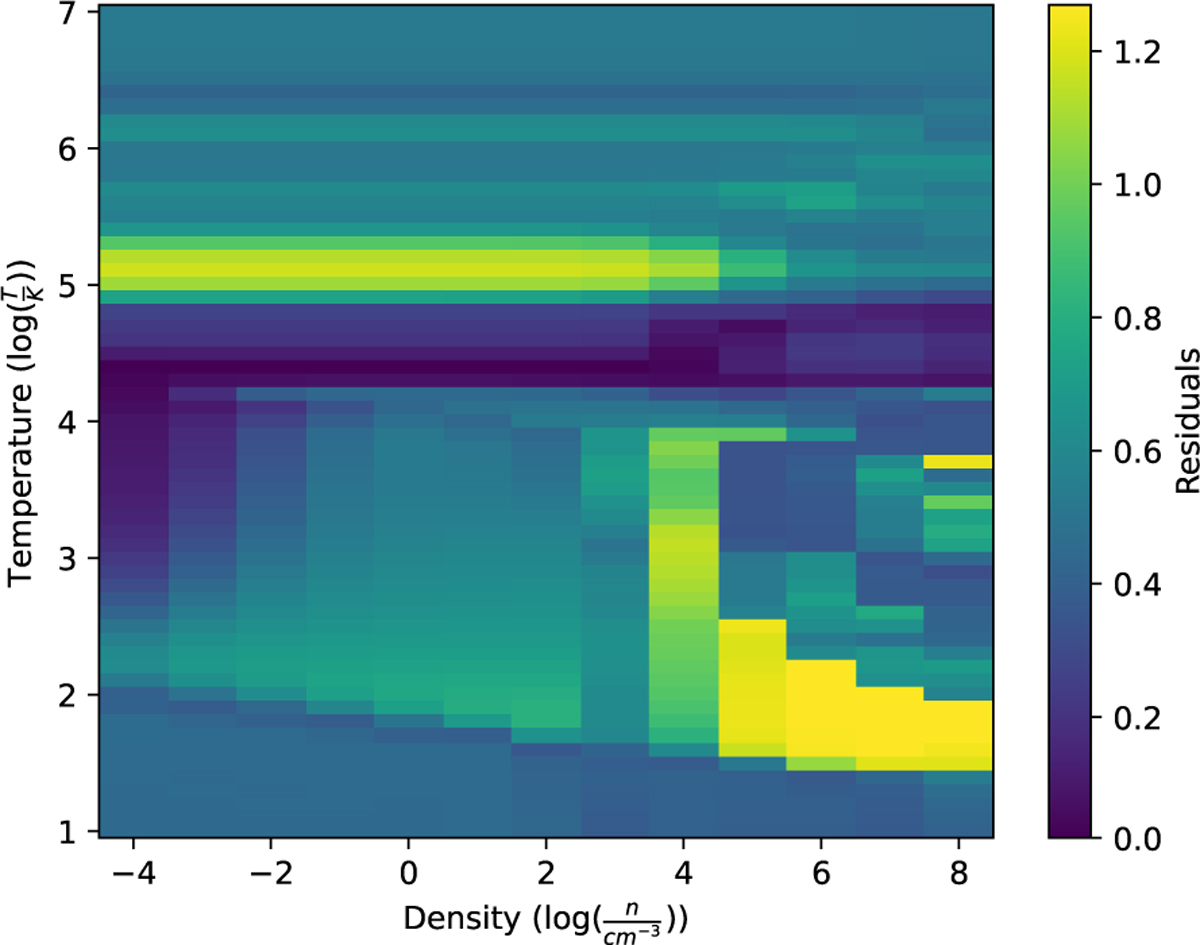
Residuals between the observed spectrum of the CND and individual CLOUDY simulations, plotted as a function of gas temperature (y axis) and density (x axis), for the best-fit abundance triplet identified in Table 2. The residuals are computed as described in Sub-section 3.3.1, with darker colors indicating a better match. A well-defined minimum is found around T ∼ 104.4 K, with weaker constraints on the density. Secondary minima are found at lower temperatures.
Current usage metrics show cumulative count of Article Views (full-text article views including HTML views, PDF and ePub downloads, according to the available data) and Abstracts Views on Vision4Press platform.
Data correspond to usage on the plateform after 2015. The current usage metrics is available 48-96 hours after online publication and is updated daily on week days.
Initial download of the metrics may take a while.