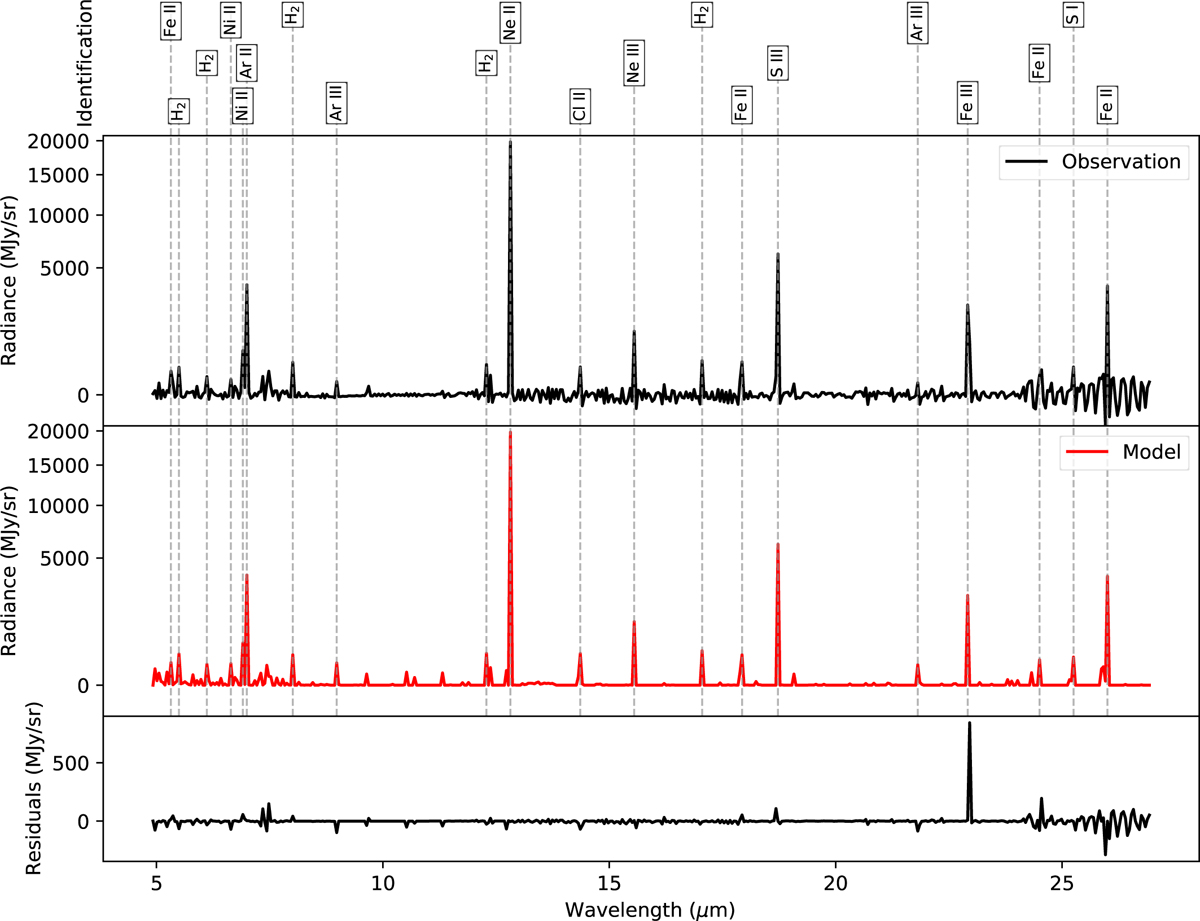
Fig. 2
Download original image
Top: observed CND spectrum. Middle: best-fit multiphase model spectrum (red). Bottom: residuals (observation minus model) as a function of wavelength. The observed spectrum is extracted over the whole CND field of view (extraction and processing in Section 2.2); the model is the best-fitting simulation from Section 4.2, using the abundances of Table 2 and the phase weights of Fig. 6. Line identifications are shown above the model panel: the most significant lines predicted by the model are marked (see Section 4.4); when multiple transitions fall within the same spectral bin, only the brightest is labeled here. The complete identification is provided in Table 3. The y axes of the observation and model spectra are shown on a square-root scale to enhance the visibility of faint features. The two curves are nearly indistinguishable over most of the range; a zoom highlighting fainter features is shown in Fig. B.1 (Appendix B).
Current usage metrics show cumulative count of Article Views (full-text article views including HTML views, PDF and ePub downloads, according to the available data) and Abstracts Views on Vision4Press platform.
Data correspond to usage on the plateform after 2015. The current usage metrics is available 48-96 hours after online publication and is updated daily on week days.
Initial download of the metrics may take a while.