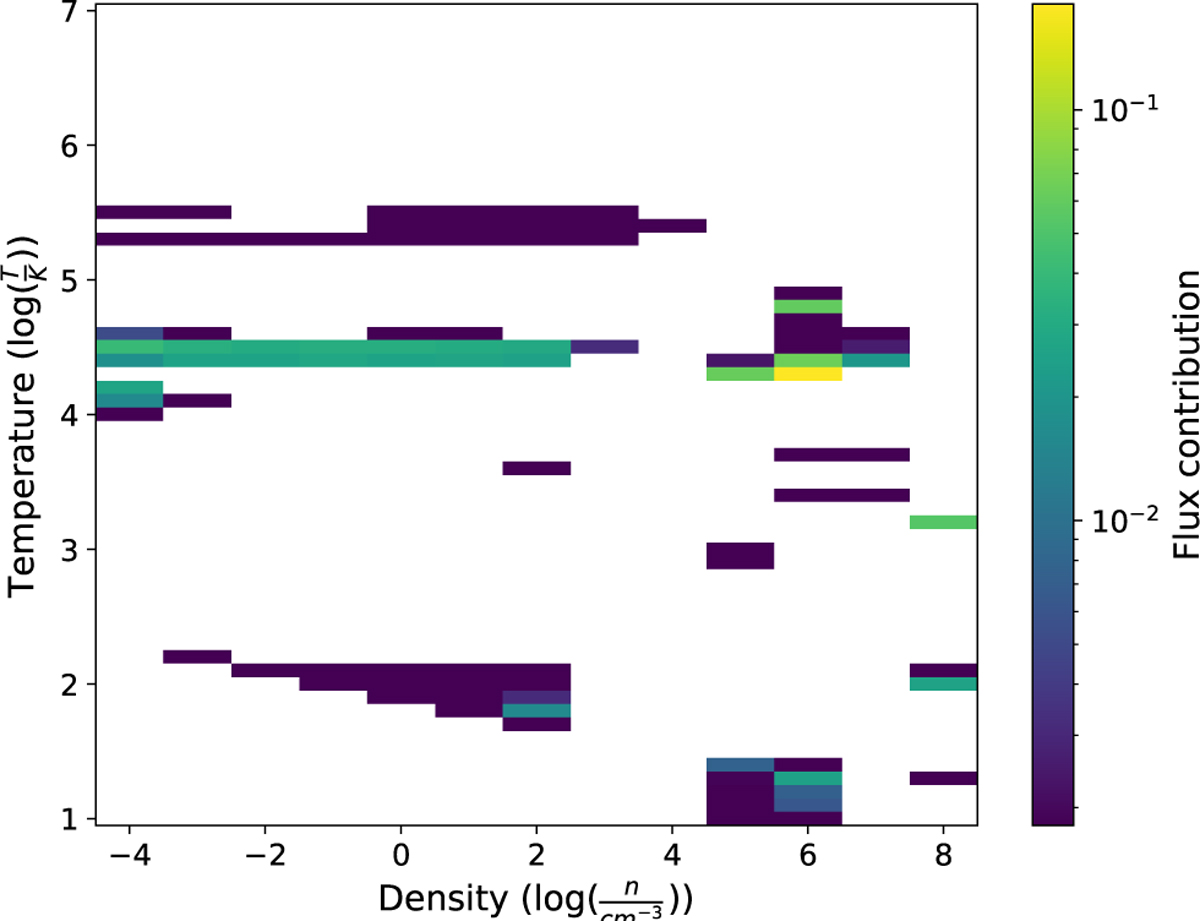
Fig. 6
Download original image
Contribution of several (T,n) gas phases to the CND spectrum in the best-fitting multiphase model (see Section 3.3.2). The map shows relative flux weights assigned to each phase, with yellow indicating strong contribution, dark blue negligible, and white null. A logarithmic color scale highlights faint components. While warm ionized gas near T ∼ 104.5 K dominates, significant cold (molecular) and hot (coronal) components confirm the multiphase nature of the emission.
Current usage metrics show cumulative count of Article Views (full-text article views including HTML views, PDF and ePub downloads, according to the available data) and Abstracts Views on Vision4Press platform.
Data correspond to usage on the plateform after 2015. The current usage metrics is available 48-96 hours after online publication and is updated daily on week days.
Initial download of the metrics may take a while.