Fig. 8
Download original image
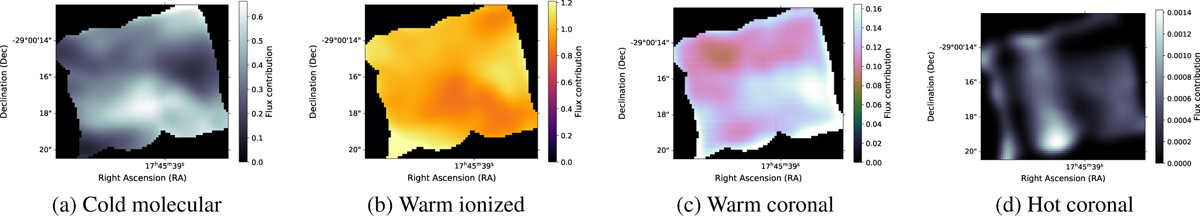
Spatial distribution of the four gas phases in the CND. Each panel shows the surface brightness contribution of a distinct phase: (a) cold molecular (T ≤ 104 K), (b) warm ionized (104–104.8 K), (c) warm coronal (104.8–105 K), and (d) hot coronal gas (T ≥ 105 K). The maps are derived by fitting the composite spectra described in Section 3.4. See Sect. 3.4 for details.
Current usage metrics show cumulative count of Article Views (full-text article views including HTML views, PDF and ePub downloads, according to the available data) and Abstracts Views on Vision4Press platform.
Data correspond to usage on the plateform after 2015. The current usage metrics is available 48-96 hours after online publication and is updated daily on week days.
Initial download of the metrics may take a while.