Fig. A.3
Download original image
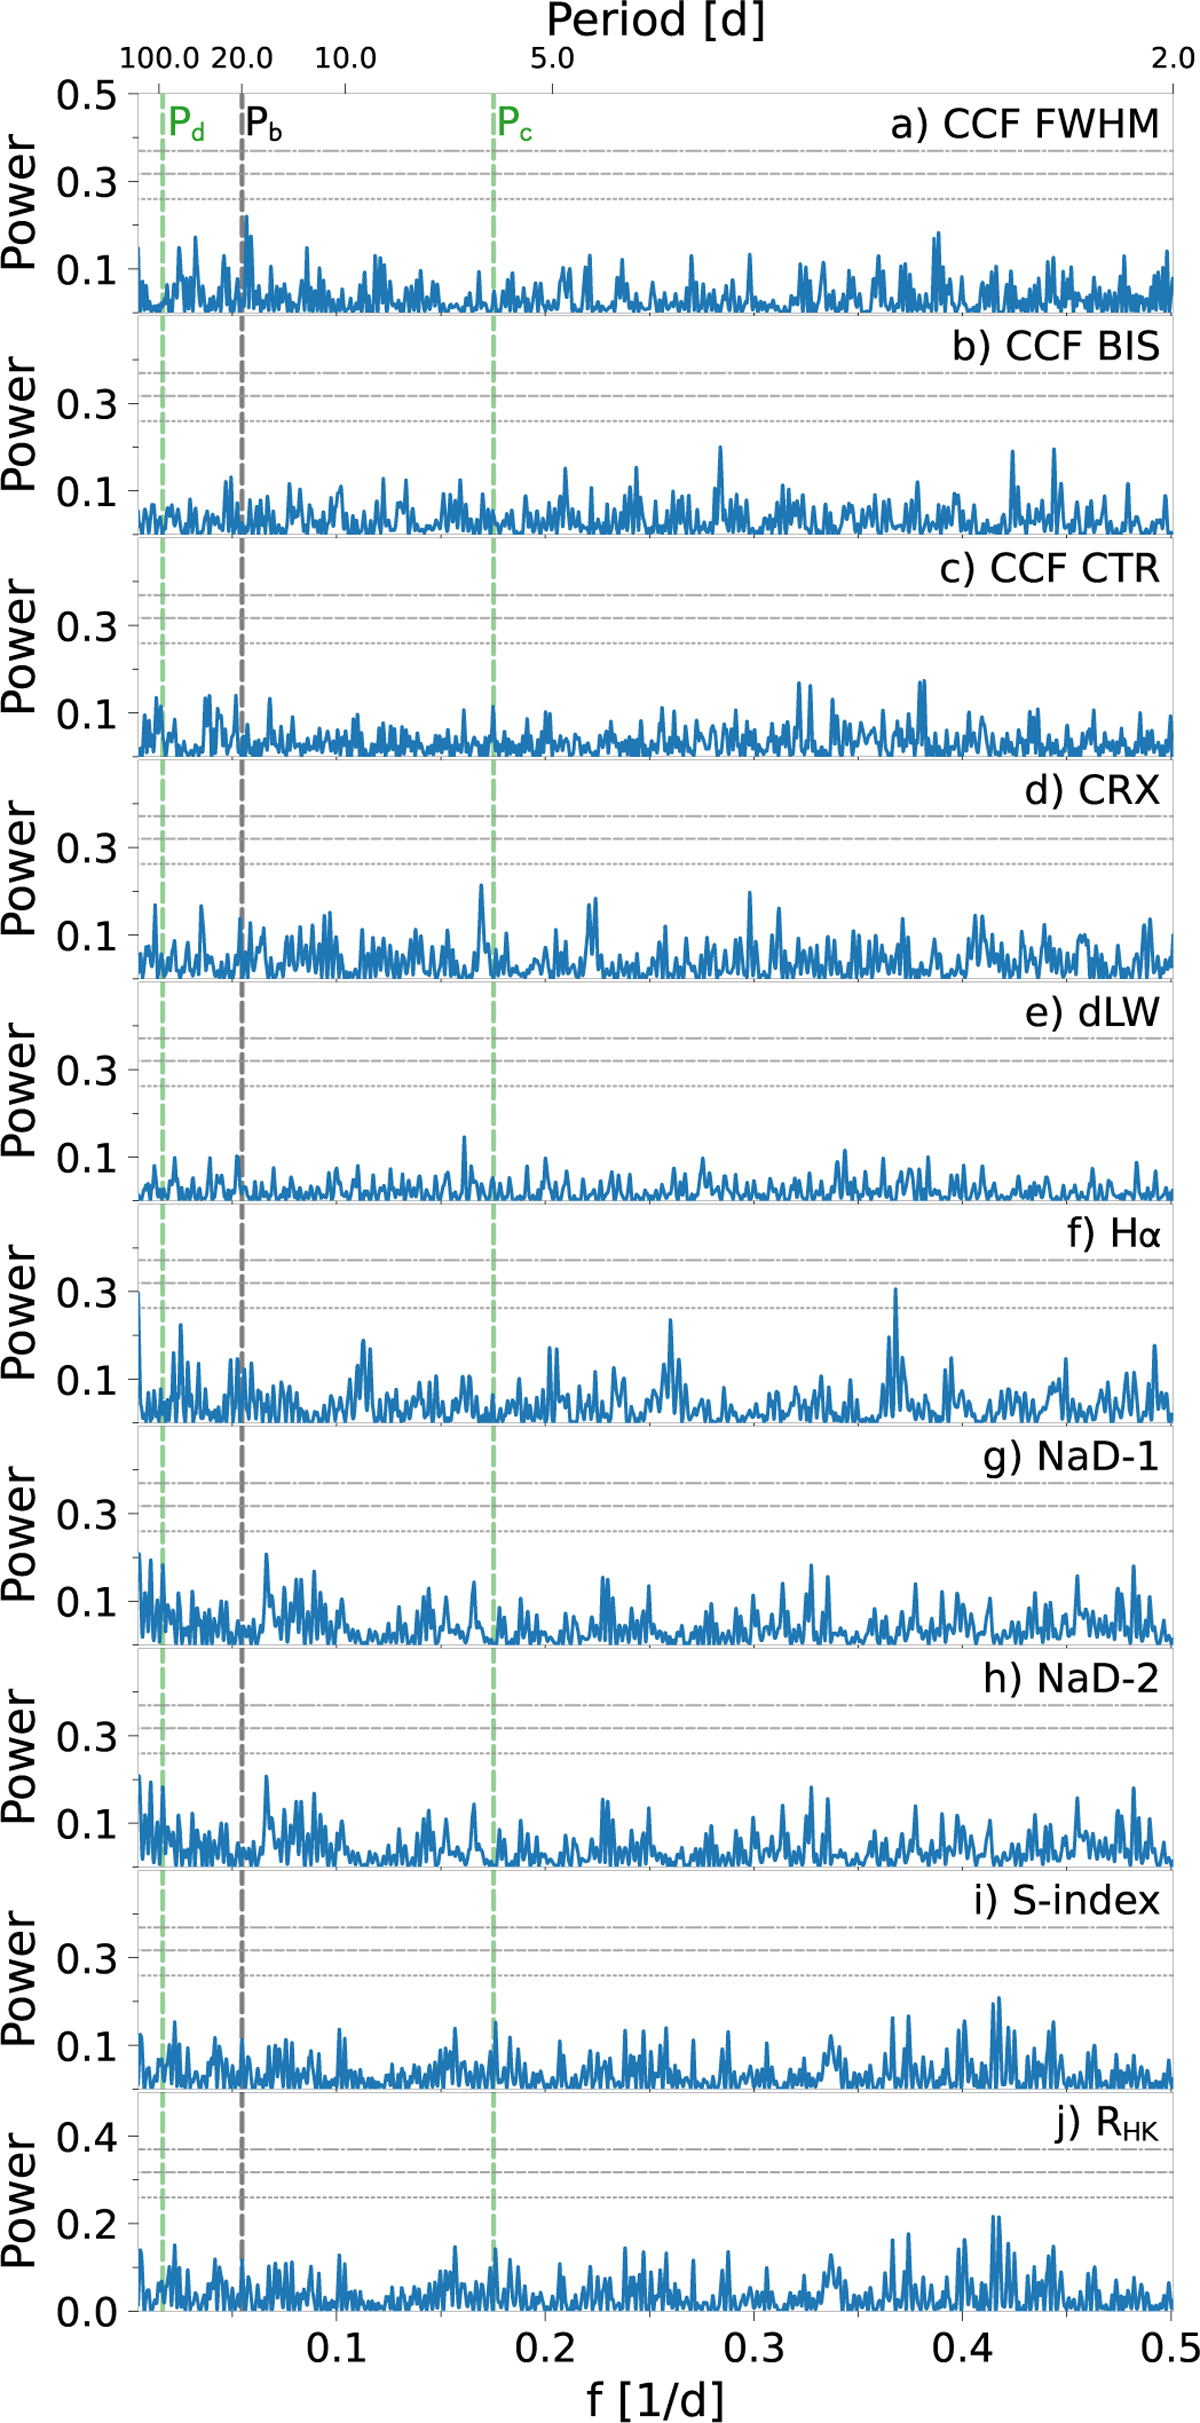
GLS periodograms of the spectral activity indicators from HARPS-N data. For each panel, the horizontal lines show the theoretical 10% (short-dashed line), 1% (long-dashed line), and 0.1% (dot-dashed line) false alarm probability levels. The vertical dashed lines mark the orbital frequencies of the transiting planet (fb = 0.0547 d−1) and of the signals detected in the RVs at 5.46 and 60 d. Panels a–c: Cross-correlation full width half maximum (FWHM), bisector (BIS), and contrast (CTR) computed with YABI. Panels d–h: Chromatic index (CRX), differential line width (dLW), Hα, and Na doublet computed with serval. Panels i–j: S-index and ![]() index computed by YABI.
index computed by YABI.
Current usage metrics show cumulative count of Article Views (full-text article views including HTML views, PDF and ePub downloads, according to the available data) and Abstracts Views on Vision4Press platform.
Data correspond to usage on the plateform after 2015. The current usage metrics is available 48-96 hours after online publication and is updated daily on week days.
Initial download of the metrics may take a while.