Fig. A.4
Download original image
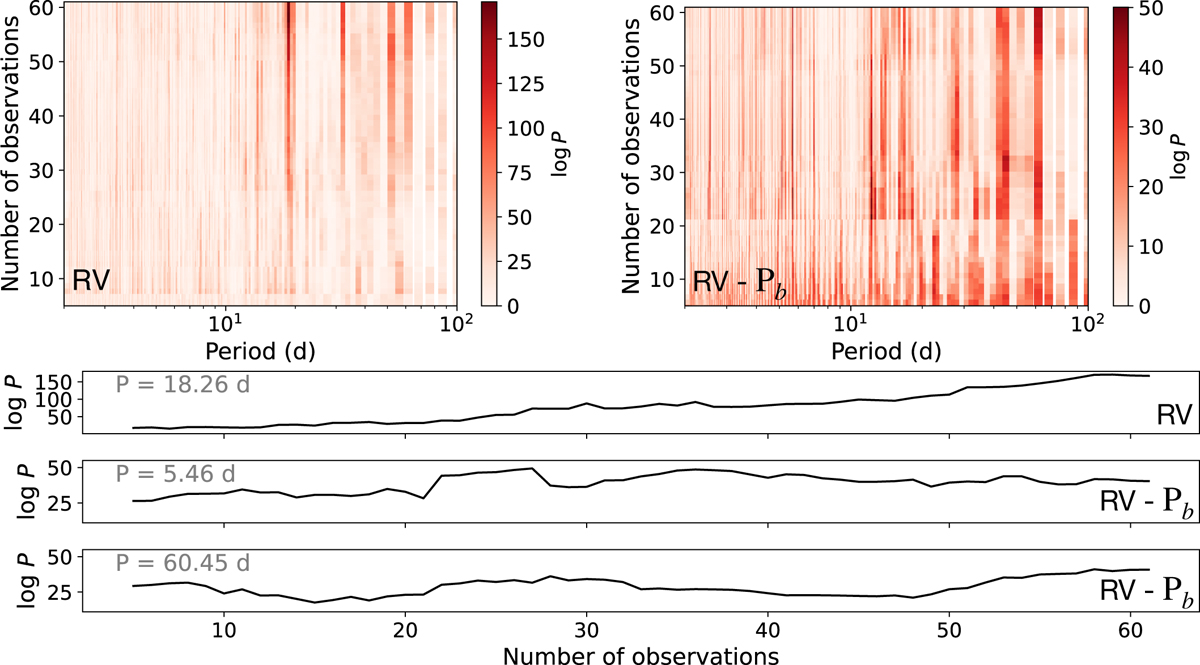
Stacked Bayesian GLS periodogram analysis of the HARPS-N dataset. Top: Periodogram of the original HARPS-N RV dataset (left) and the HARPS-N RV dataset after modeling of the transiting planet TOI-2141 b (right). The amount of observations is plotted against period, with the color scale indicating the logarithm of the power or probability of a coherent long-lived signal, where darker is more likely. Bottom: Power as a function of the number of observations for the three RV signals of interest in the system: the transiting planet at 18.26 d (top), the inner non-transiting planet at 5.46 d (middle), and the outer non-transiting planet at 60.45 d (bottom). The first panel is computed from the original RV dataset, the next two from the residuals of fitting the transiting planet. The monotonic increase of power as afunction of number of observations is typical of bonafide planets and not of astrophysical or instrumental origin (Mortier & Collier Cameron 2017).
Current usage metrics show cumulative count of Article Views (full-text article views including HTML views, PDF and ePub downloads, according to the available data) and Abstracts Views on Vision4Press platform.
Data correspond to usage on the plateform after 2015. The current usage metrics is available 48-96 hours after online publication and is updated daily on week days.
Initial download of the metrics may take a while.