Fig. 2
Download original image
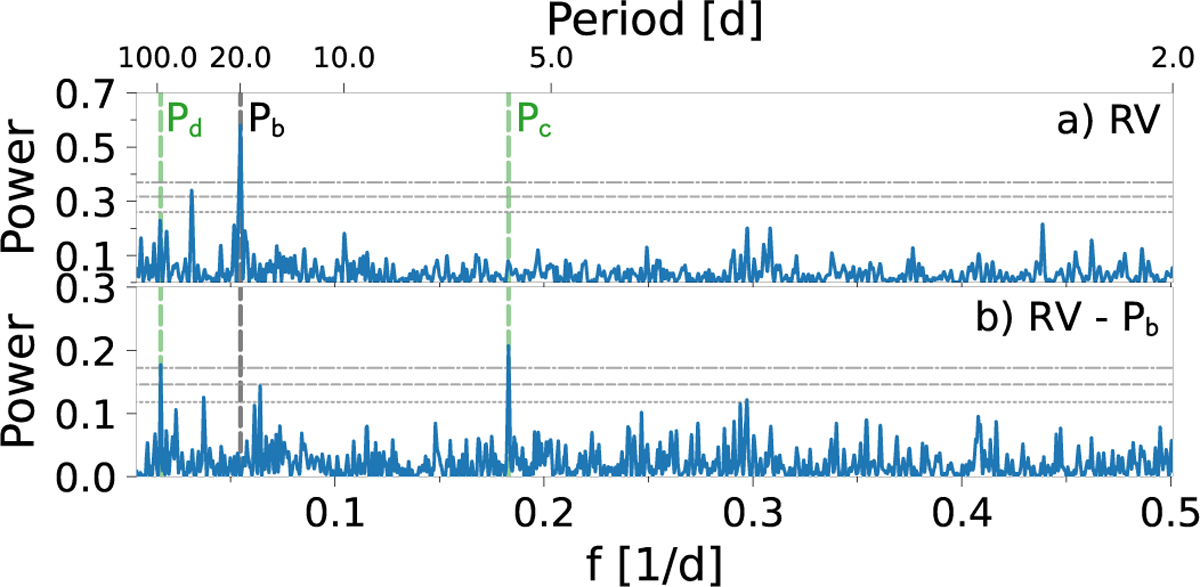
GLS periodograms of the SOPHIE and HARPS-N RV data. For each panel, the horizontal lines show the theoretical 10% (short-dashed line), 1% (long-dashed line), and 0.1% (dot-dashed line) false alarm probability levels. The vertical dashed lines mark the orbital frequencies of the transiting planet (fb = 0.0547 d−1) and of the signals detected in the RVs at 5.46 and 60 d. Panel a: Combined RV data corrected for an instrumental offset. Panel b: RV residuals following the subtraction of the signal of the transiting planet TOI-2141 b.
Current usage metrics show cumulative count of Article Views (full-text article views including HTML views, PDF and ePub downloads, according to the available data) and Abstracts Views on Vision4Press platform.
Data correspond to usage on the plateform after 2015. The current usage metrics is available 48-96 hours after online publication and is updated daily on week days.
Initial download of the metrics may take a while.