Fig. 6
Download original image
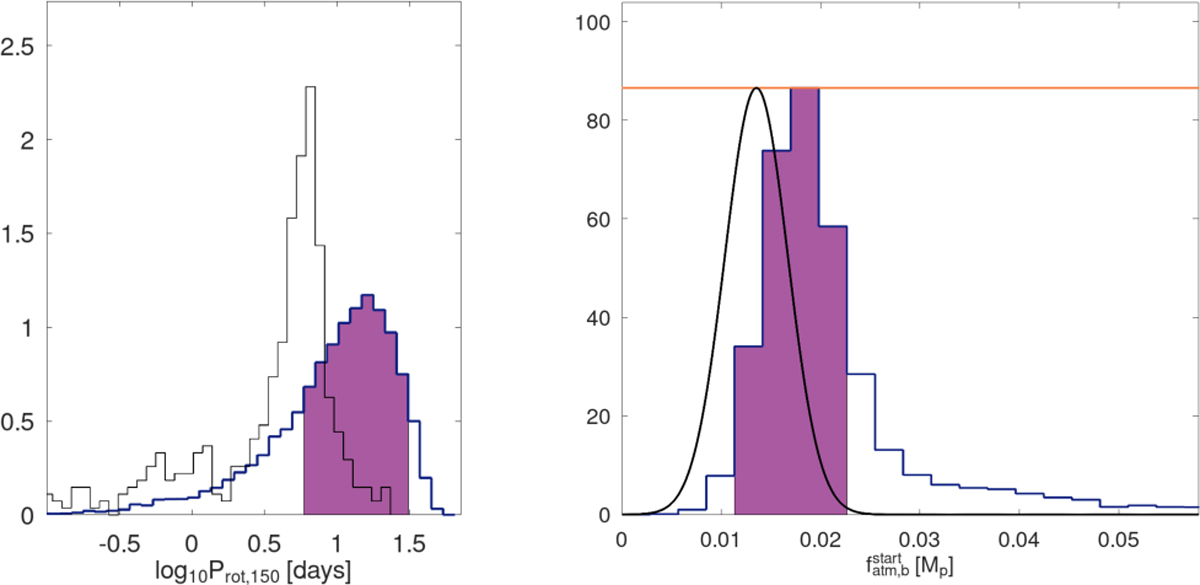
Posterior distributions (pdf) as derived from PASTA (blue histograms), with the violet area that highlights the 68.3% highest probability density interval. Left panel: rotation period pdf of TOI-2141 when the star was 150 Myr old (Prot,150) compared with the Prot,150 distribution of stars of comparable masses (black histogram) as extracted from the sample by Johnstone et al. (2015a). Right panel: initial atmospheric mass fraction (![]() ) pdf of TOI-2141 b compared with the model-inferred present-day atmospheric content (black line). The orange horizontal line marks the uniform prior that was imposed on
) pdf of TOI-2141 b compared with the model-inferred present-day atmospheric content (black line). The orange horizontal line marks the uniform prior that was imposed on ![]() .
.
Current usage metrics show cumulative count of Article Views (full-text article views including HTML views, PDF and ePub downloads, according to the available data) and Abstracts Views on Vision4Press platform.
Data correspond to usage on the plateform after 2015. The current usage metrics is available 48-96 hours after online publication and is updated daily on week days.
Initial download of the metrics may take a while.