Fig. A.1
Download original image
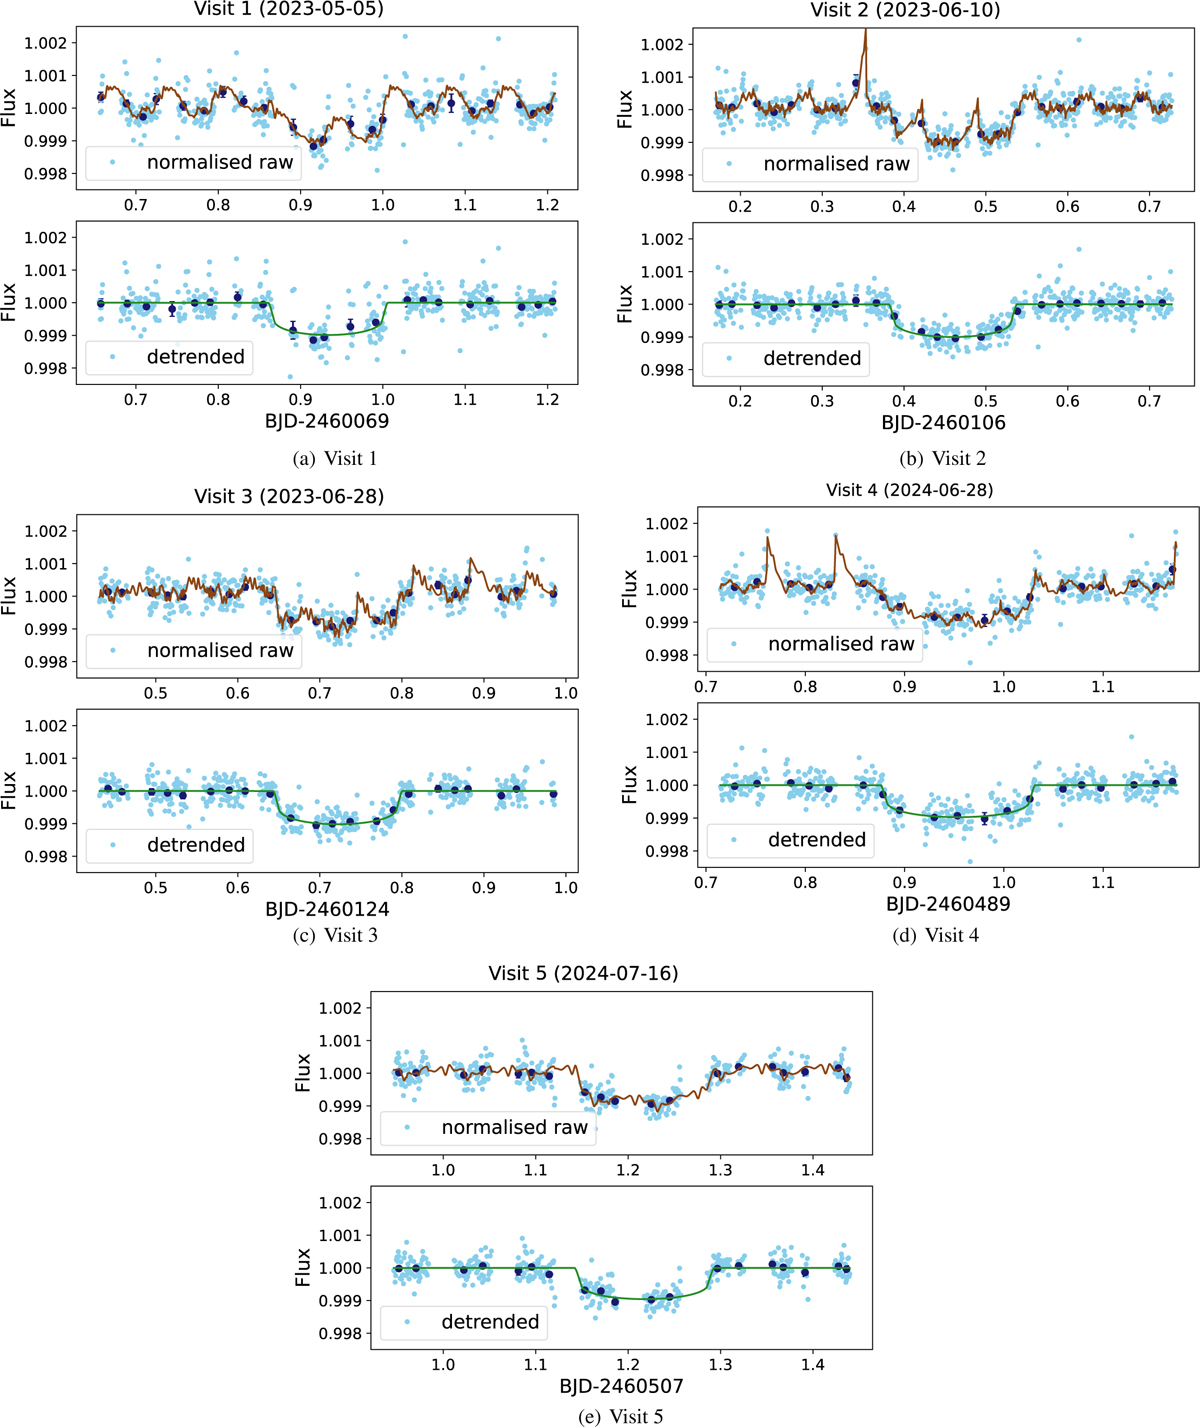
CHEOPS photometry of TOI-2141 analysed using pycheops (see text). The transits of planet c were observed in five separate visits. Top panels show the normalised raw CHEOPS light curve (sky blue), the binned raw light curve (dark blue), and the best fitted GP+transit model (brown line). Bottom panel shows the detrended light curves (sky blue), the binned, detrended light curve and the best-fitted transit model (green).
Current usage metrics show cumulative count of Article Views (full-text article views including HTML views, PDF and ePub downloads, according to the available data) and Abstracts Views on Vision4Press platform.
Data correspond to usage on the plateform after 2015. The current usage metrics is available 48-96 hours after online publication and is updated daily on week days.
Initial download of the metrics may take a while.