Fig. 5
Download original image
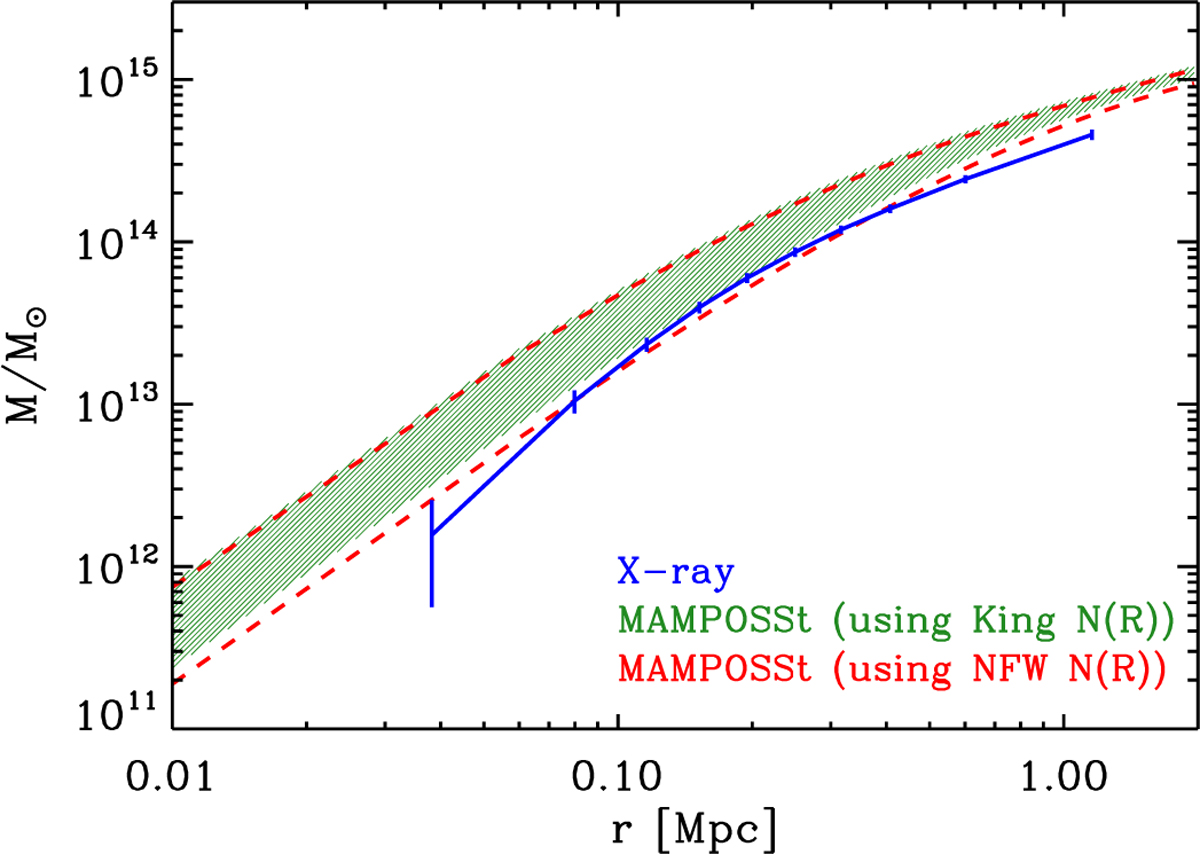
A267 M(r) as derived from X-ray data (blue points with one sigma error bars; the solid blue line connects the profile points and is shown for the sake of clarity only) and from MAMPOSSt, using the King and NFW models for N(R) (hatched green region and dashed red lines, respectively), indicating the 1σ interval derived by randomly selecting 5000 r200, rs values of the NFW profile from the MCMC steps and taking the 16–84 percentiles of the mass values at 40 radial positions.
Current usage metrics show cumulative count of Article Views (full-text article views including HTML views, PDF and ePub downloads, according to the available data) and Abstracts Views on Vision4Press platform.
Data correspond to usage on the plateform after 2015. The current usage metrics is available 48-96 hours after online publication and is updated daily on week days.
Initial download of the metrics may take a while.