Open Access
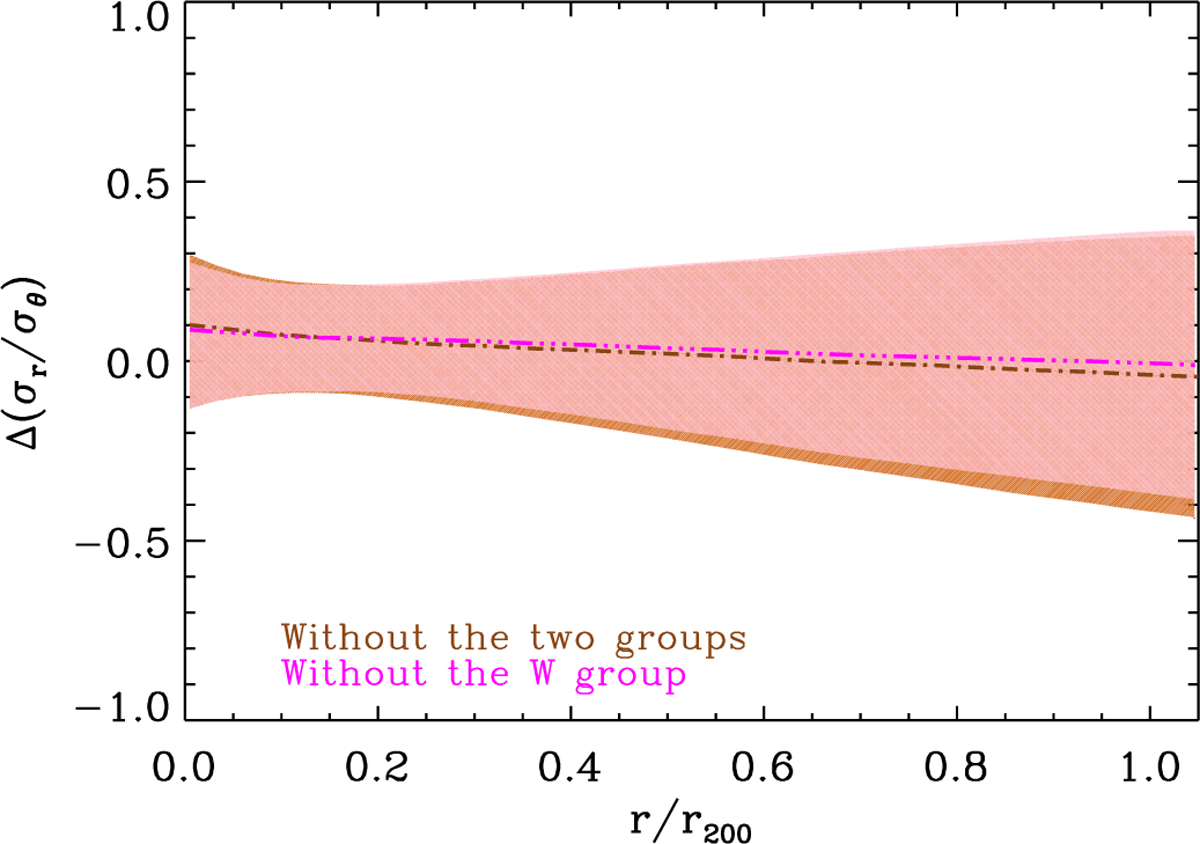
Fig. 8
Download original image
Brown dot-dashed line and shading (respectively: magenta triple-dot-dashed line and pink shading): difference between the velocity anisotropy profile obtained after removing the W and N groups (respectively: only the W group). The shading indicates the 1 σ confidence interval of the difference.
Current usage metrics show cumulative count of Article Views (full-text article views including HTML views, PDF and ePub downloads, according to the available data) and Abstracts Views on Vision4Press platform.
Data correspond to usage on the plateform after 2015. The current usage metrics is available 48-96 hours after online publication and is updated daily on week days.
Initial download of the metrics may take a while.