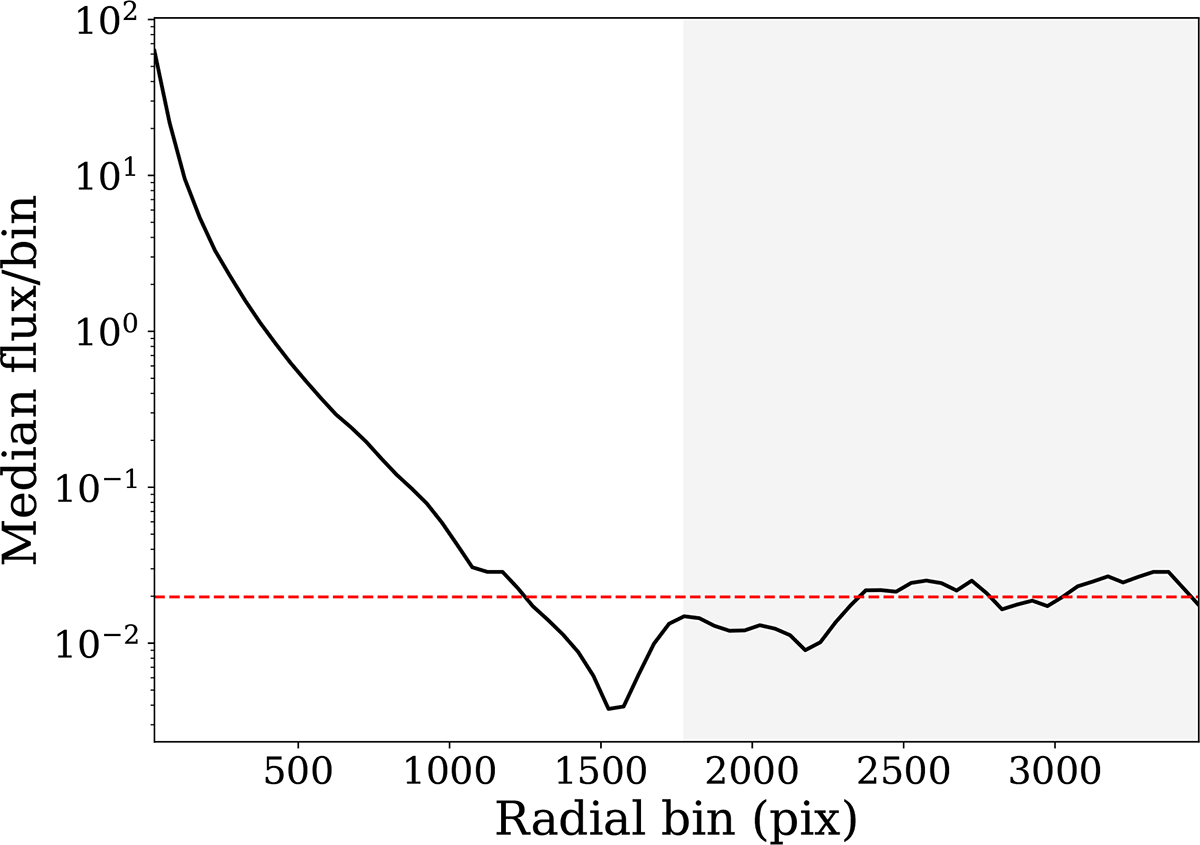
Fig. 3.
Download original image
Example of the procedure to estimate the i-band background of NGC 5831. The solid black line shows the radial profile of the flux in the input image, azimuthally averaged in circular bins of 50 pixels. The shaded gray area is the region where the background is estimated. The dashed red line represents the background estimated with the method described in the text.
Current usage metrics show cumulative count of Article Views (full-text article views including HTML views, PDF and ePub downloads, according to the available data) and Abstracts Views on Vision4Press platform.
Data correspond to usage on the plateform after 2015. The current usage metrics is available 48-96 hours after online publication and is updated daily on week days.
Initial download of the metrics may take a while.