Fig. 4.
Download original image
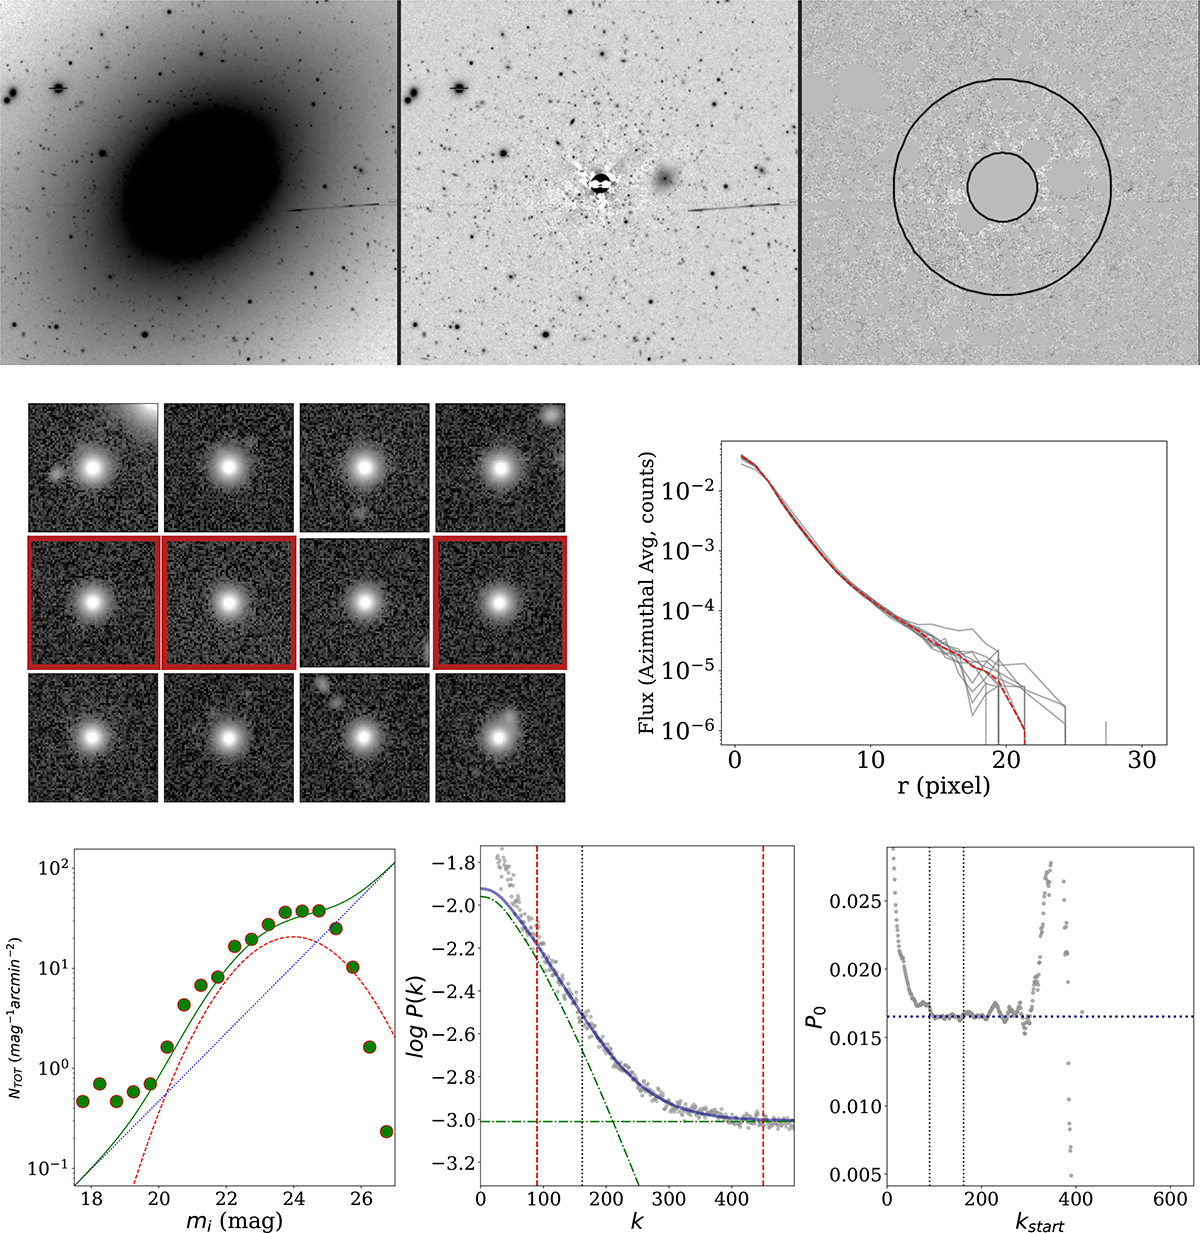
SBF analysis images and plots for NGC 5813. Top row: i-band image, residual, and residual masked image (left to right). The black circles in the third panel show the inner and outer radii of the annulus adopted for the SBF measurements. Middle row: Example of the PSF selection process. In the left panel are shown the stars pre-selected based on photometric criteria. Stars highlighted with red borders represent a subsample of those subsequently chosen for the fitting. In the right panel, the radial profile of the full sample of PSF selected is shown. The red line shows the median profile, while thin gray lines are azimuthal averaged profiles of single PSFs. The PSFs are normalized to have a total energy of one. Bottom left panel: Fit luminosity function of external sources. The green circles represent the binned observational data. The solid green curve is the best fit to the data. The two components of the luminosity function, the background galaxies and GCLF, are shown with dotted blue and dashed red curves, respectively. Bottom middle panel: Azimuthal average of the residual image power spectrum using one of the good PSFs. The gray dots represent the observational data. The solid blue curve is the fit obtained according to the procedure described in the text. The dashed red lines represent the range of wavenumbers used for the fit. The dashed green curve shows the PSF power spectrum. The horizontal dotted green line represents the fit white noise value P1. Bottom right panel: Estimated P0 (gray dots) at different kstart; the vertical dotted black lines indicate the most stable region in which P0 is calculated, while the horizontal one is the final value of P0 for the specific PSF.
Current usage metrics show cumulative count of Article Views (full-text article views including HTML views, PDF and ePub downloads, according to the available data) and Abstracts Views on Vision4Press platform.
Data correspond to usage on the plateform after 2015. The current usage metrics is available 48-96 hours after online publication and is updated daily on week days.
Initial download of the metrics may take a while.