Fig. F.1
Download original image
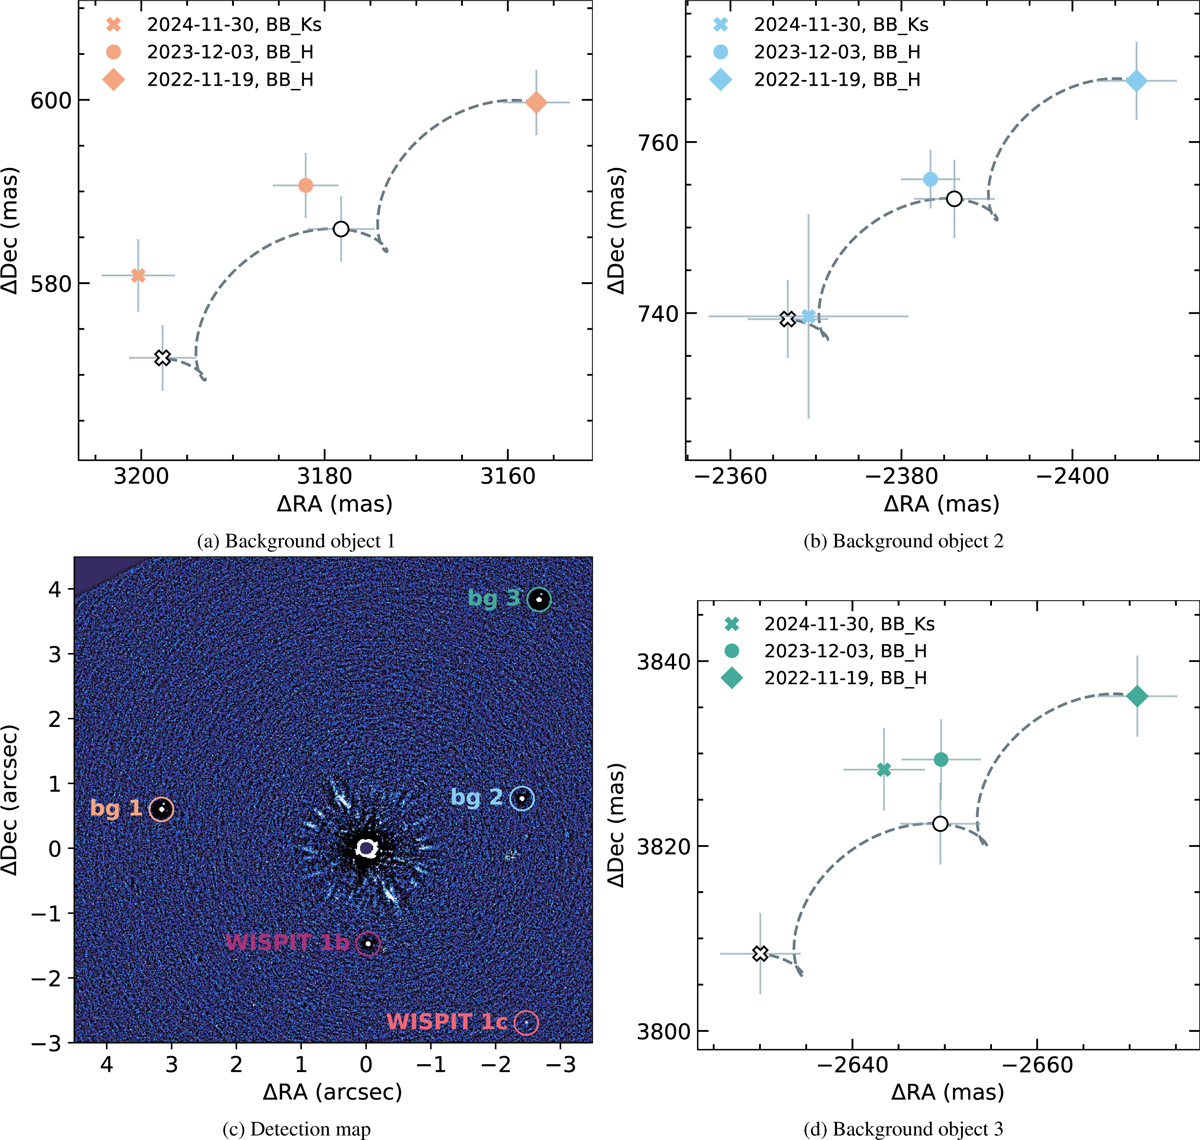
Proper motion analysis of all background sources in the field of view. The detection map in panel (c) shows the positions of the sources relative to WISPIT 1 in the observation of epoch 2022-10-19 processed with unsharp masking. The three background sources are shown in panels (a), (b), and (d), respectively. Each epoch is marked with a unique marker shape; diamond (2022), circle (2023) and cross (2024). The coloured version of the marker indicates the measured position of the companion. The unfilled (black outline, white centre) version of this marker indicates the position that the companion would have been at at the corresponding date if it were a background object. The dashed curve depicts the parallactic track of a stationary background object from first epoch to last epoch. The χ2 between the measured positions of background objects 1, 2 and 3 are 10.6, 1.1 and 32.2, respectively.
Current usage metrics show cumulative count of Article Views (full-text article views including HTML views, PDF and ePub downloads, according to the available data) and Abstracts Views on Vision4Press platform.
Data correspond to usage on the plateform after 2015. The current usage metrics is available 48-96 hours after online publication and is updated daily on week days.
Initial download of the metrics may take a while.