Fig. 2
Download original image
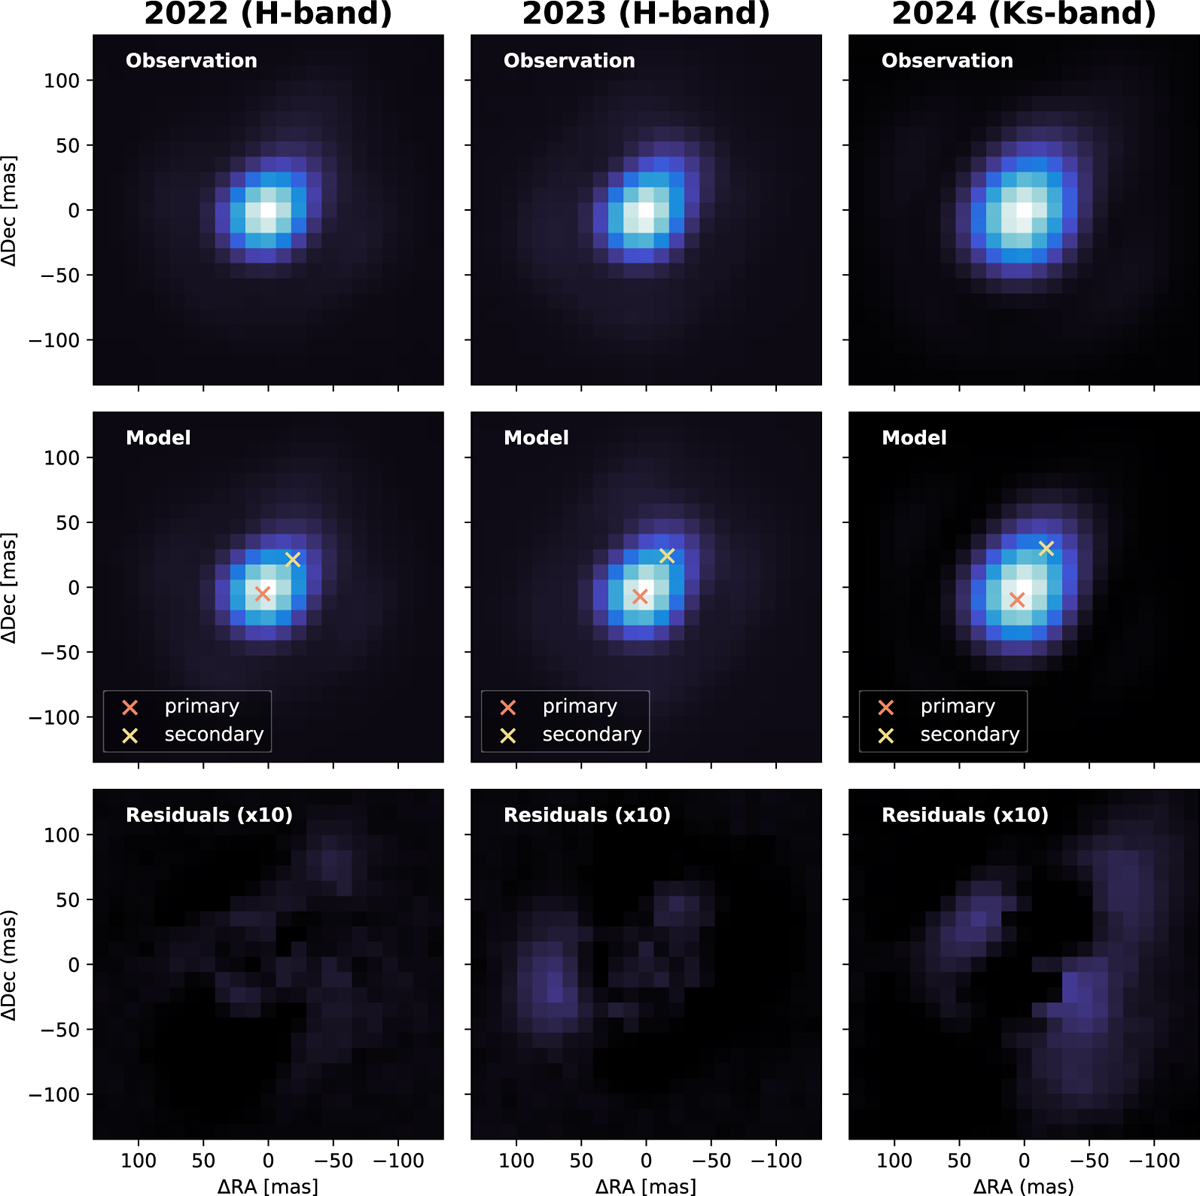
Synthetic binary model fit to the flux calibration images of WISPIT 1 over three different epochs. The top row shows the observation; the second row shows the best-fit synthetic binary model, with the best-fit positions of the primary star and secondary star marked with crosses; the bottom row shows the residuals. The model and residuals inherit the colour scale from the corresponding observation, demonstrating the similarity in intensity between model and observation. The residual images are multiplied by a factor of ten, and show minor structures on the order of magnitude of less than ~5% of the peak flux of the observation.
Current usage metrics show cumulative count of Article Views (full-text article views including HTML views, PDF and ePub downloads, according to the available data) and Abstracts Views on Vision4Press platform.
Data correspond to usage on the plateform after 2015. The current usage metrics is available 48-96 hours after online publication and is updated daily on week days.
Initial download of the metrics may take a while.