Fig. 5
Download original image
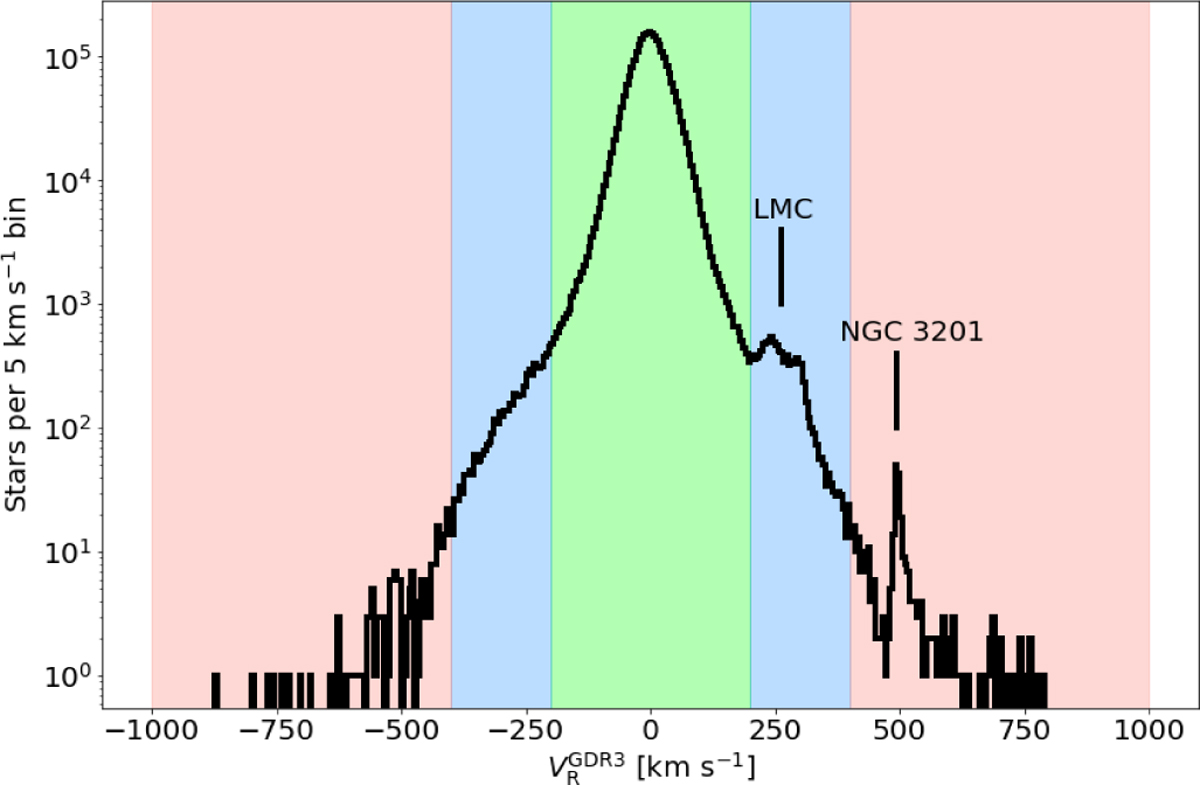
Distribution of the Gaia DR3 radial velocities of the sample of 2.7 million stars used to assess the rate of outliers as a function of S/N and for three different intervals of absolute values of the radial velocities. The three intervals are materialised in green ([0, 200) km s−1), blue ([200, 400) km s−1) and salmon ([400, 1000) km s−1) respectively. We note that the Large Magellanic Cloud (LMC) and the Globular Cluster NGC 3201 both produce a peak visible on top of the distribution of Milky Way stars.
Current usage metrics show cumulative count of Article Views (full-text article views including HTML views, PDF and ePub downloads, according to the available data) and Abstracts Views on Vision4Press platform.
Data correspond to usage on the plateform after 2015. The current usage metrics is available 48-96 hours after online publication and is updated daily on week days.
Initial download of the metrics may take a while.