Fig. 1
Download original image
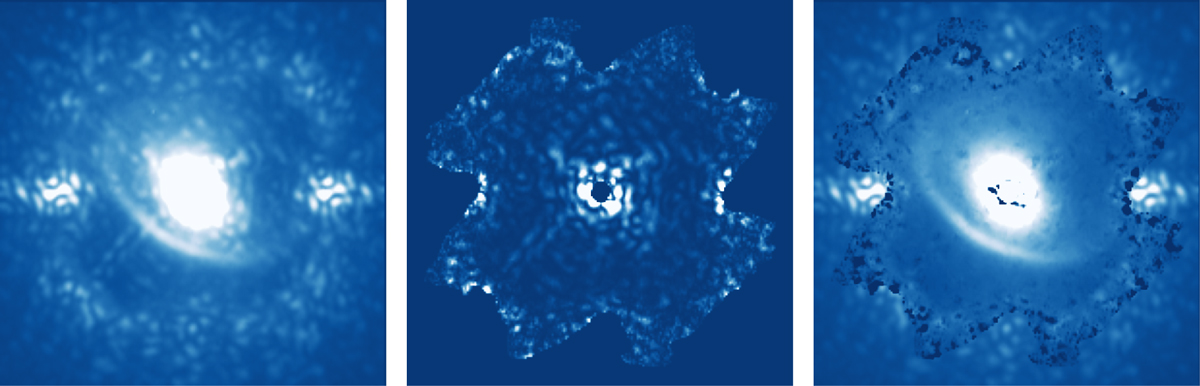
Image decomposition of HD 163296 through CDI. Left: coronagraph image with no probe (i.e., total intensity image). Center: PWP-estimated speckle field. Right: CDI result (estimated astrophysical scene subtracted from the total intensity image) after one sequence of PWP. The negative values, indicated by black-colored regions, show local over-subtraction in areas where PWP cannot properly estimate the speckle field.
Current usage metrics show cumulative count of Article Views (full-text article views including HTML views, PDF and ePub downloads, according to the available data) and Abstracts Views on Vision4Press platform.
Data correspond to usage on the plateform after 2015. The current usage metrics is available 48-96 hours after online publication and is updated daily on week days.
Initial download of the metrics may take a while.