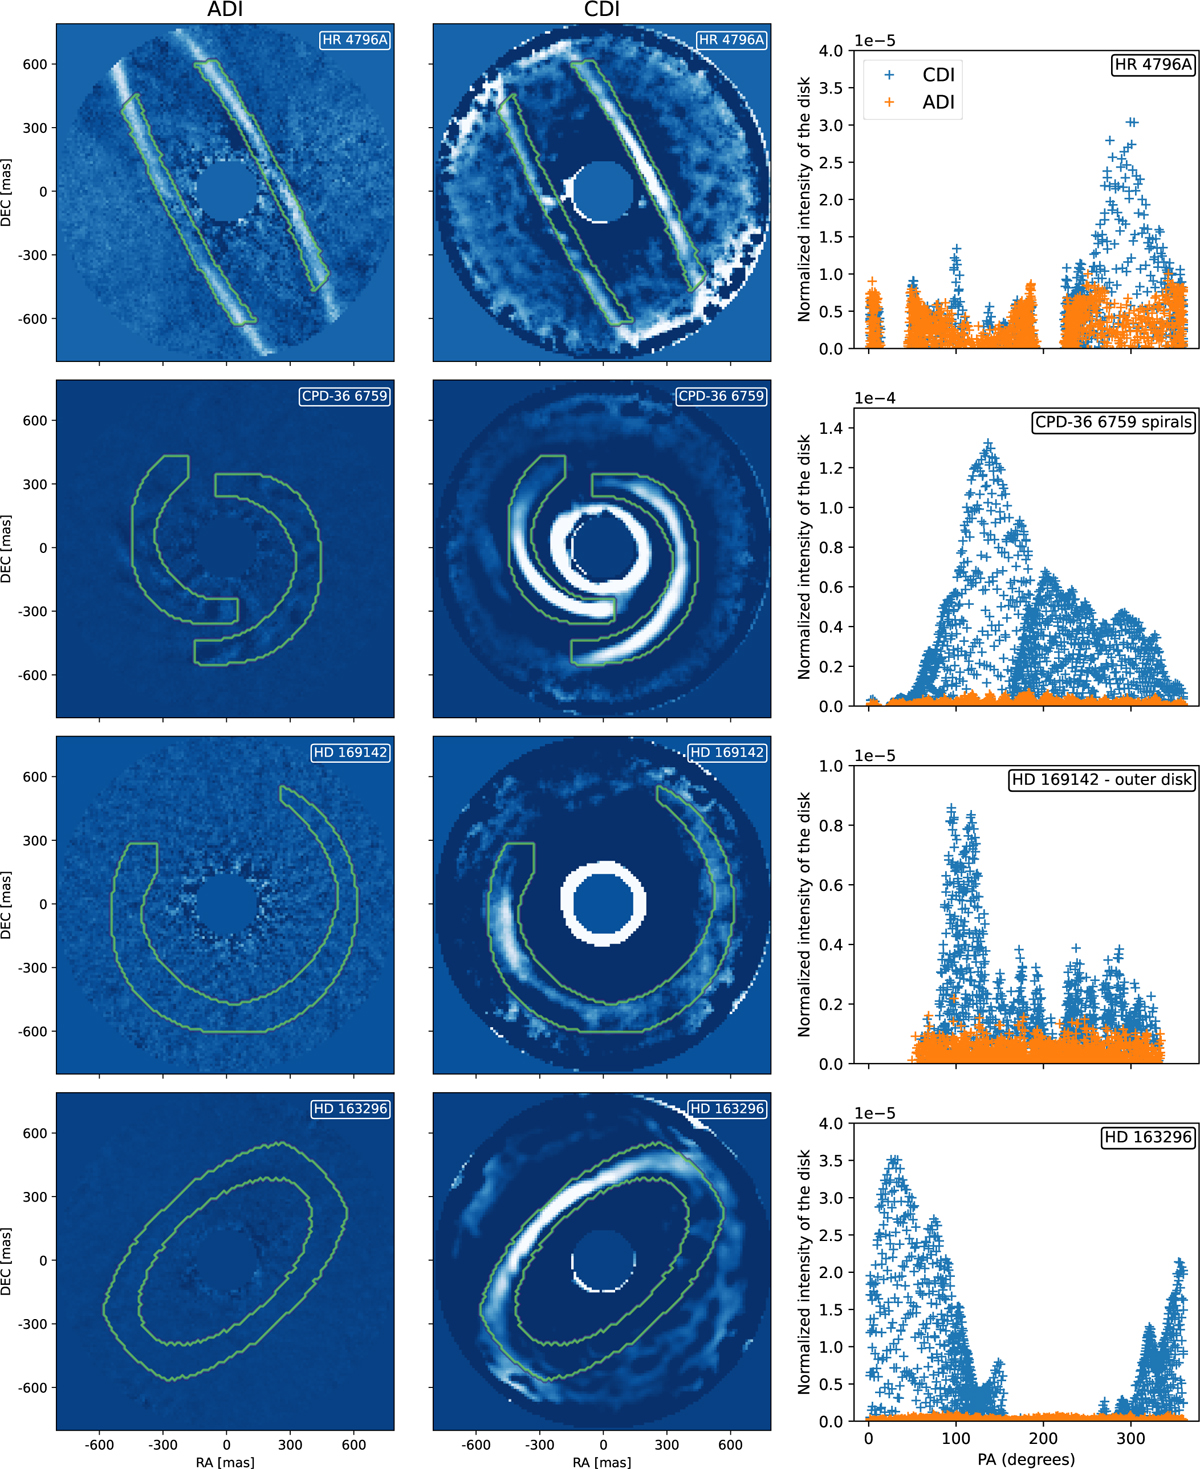
Fig. 4
Download original image
Comparison of disk images obtained with ADI (left column) and CDI (center column). For each disk, the ADI and CDI images are displayed using the same color scale; however, the scales vary from one disk to another. ADI and CDI results were obtained through the same dataset. We use K-klip ADI (Soummer et al. 2012) with Kklip = Nfilt/2. Right column: comparison of disk intensities, for pixels inside the region encircled in green, obtained with both ADI and CDI as a function of the position angle.
Current usage metrics show cumulative count of Article Views (full-text article views including HTML views, PDF and ePub downloads, according to the available data) and Abstracts Views on Vision4Press platform.
Data correspond to usage on the plateform after 2015. The current usage metrics is available 48-96 hours after online publication and is updated daily on week days.
Initial download of the metrics may take a while.