Fig. 11
Download original image
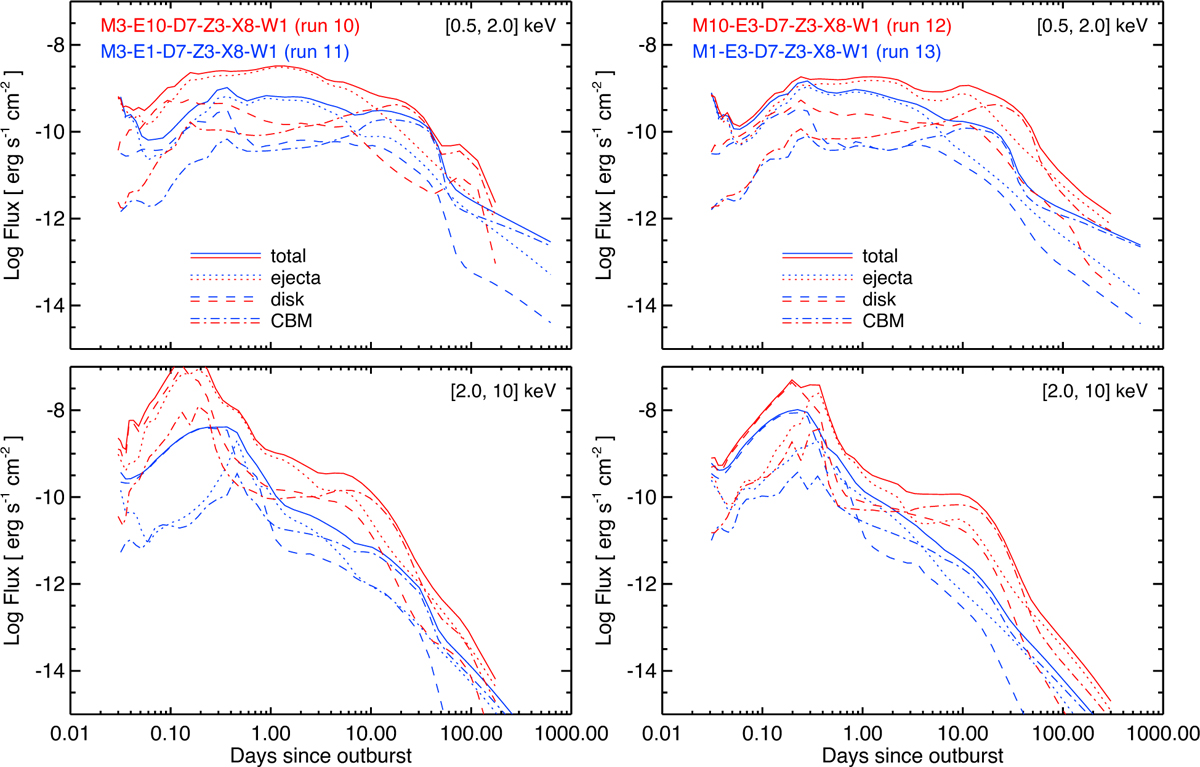
X-ray light curves synthesized from the HD models in the [0.5, 2] keV (upper panels) and [2, 10] keV (lower panels) energy bands. Left panels: comparison between two models with different explosion energies (Runs 10 and 11). Right panels: comparison between two models with different ejecta masses (Runs 12 and 13). The dotted, dashed, and dot-dashed lines show the contributions to the total emission from the shocked ejecta, shocked disk material, and shocked CBM (EDE and RG wind) plasma, respectively.
Current usage metrics show cumulative count of Article Views (full-text article views including HTML views, PDF and ePub downloads, according to the available data) and Abstracts Views on Vision4Press platform.
Data correspond to usage on the plateform after 2015. The current usage metrics is available 48-96 hours after online publication and is updated daily on week days.
Initial download of the metrics may take a while.