Fig. 2
Download original image
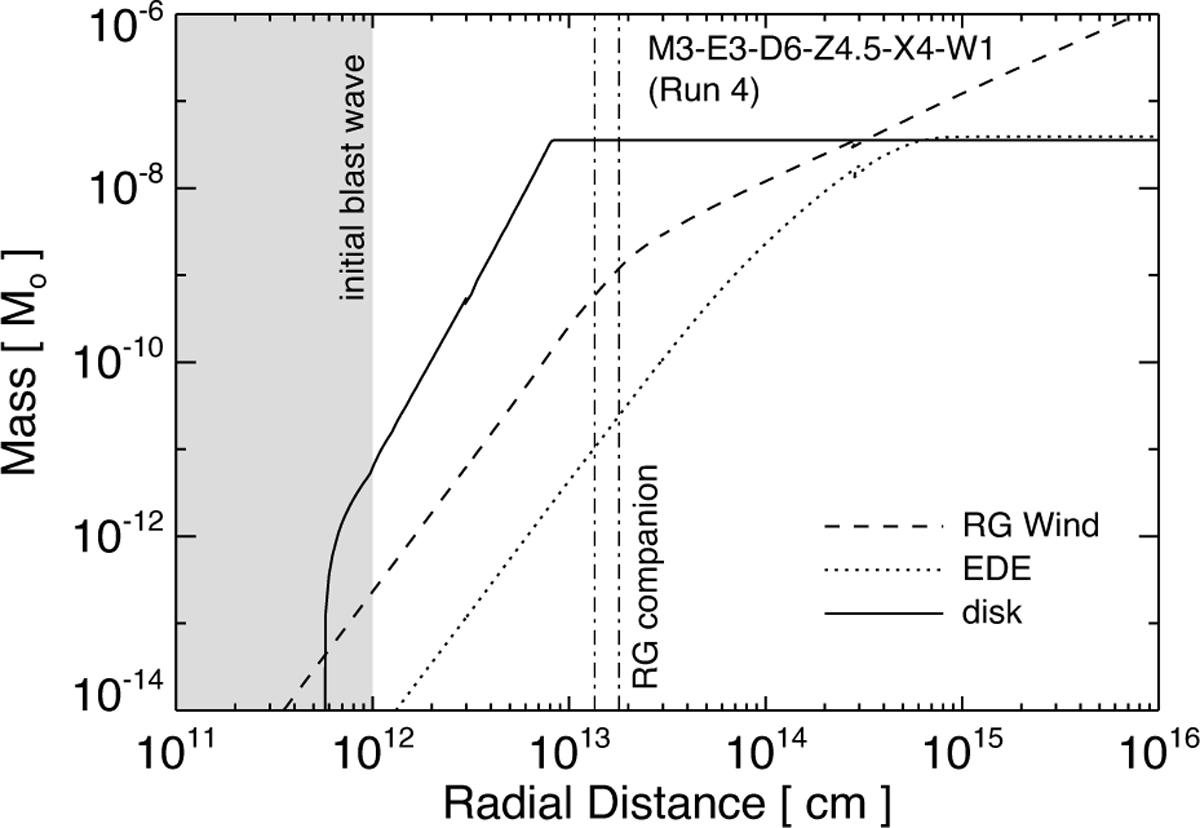
Cumulative mass of the CBM enclosed within a given radius as a function of radial distance from the WD for model M3-E3-D6-Z4.5-X4-W1 (Run 4 in Table 2). The plot shows contributions from the spherical RG wind (dashed line), the EDE (dotted line), and the accretion disk (solid line). The shaded region on the left marks the extent of the initial blast wave; the CBM is not described within this zone in the simulation. Vertical dot-dashed lines indicate the position of the RG companion along the x axis.
Current usage metrics show cumulative count of Article Views (full-text article views including HTML views, PDF and ePub downloads, according to the available data) and Abstracts Views on Vision4Press platform.
Data correspond to usage on the plateform after 2015. The current usage metrics is available 48-96 hours after online publication and is updated daily on week days.
Initial download of the metrics may take a while.