Fig. 3
Download original image
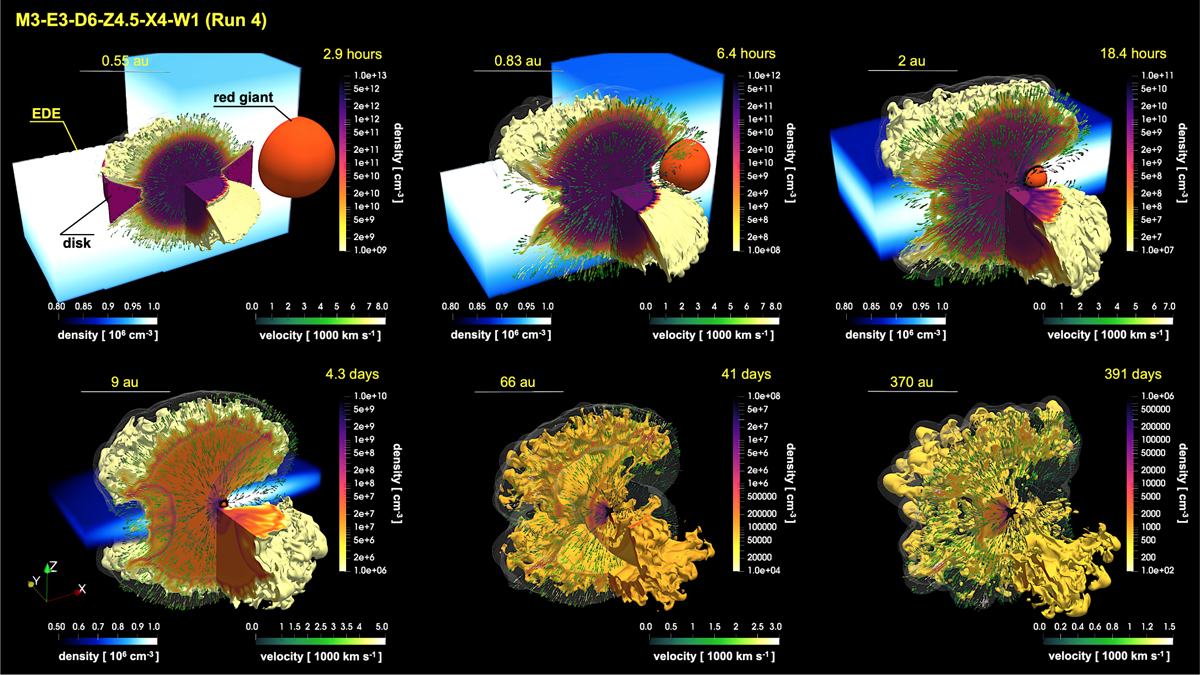
Evolution of the blast wave in reference model M3-E3-D6-Z4.5-X4-W1 (see Run 4 in Table 2 for model parameters). Each panel displays the 3D density structure of the nova remnant at the indicated time (upper right corner of each panel), with a yardstick in the upper left corner denoting the spatial scale. The colored isosurface traces the distribution of the ejecta, with color representing local gas density (see color bar at right of each panel). The isosurface is partially clipped to expose the internal structure of the remnant. A semitransparent gray isosurface outlines the forward shock. The RG companion is shown as an orange sphere, most visible at early times (top panels). The accretion disk, rendered in violet around the WD, only appears in the earliest frame (upper left panel). Green arrows indicate the velocity field of the outflowing plasma, with the arrow color encoding the flow speed (color bar at lower right). The EDE is visible at times earlier than 40 days (upper panels and lower left panel), rendered in blue (color bar at lower left), and is partially clipped to reveal the remnant structure. The blast wave is visibly collimated along the polar directions, shaped by the combined influence of the EDE and the accretion disk.
Current usage metrics show cumulative count of Article Views (full-text article views including HTML views, PDF and ePub downloads, according to the available data) and Abstracts Views on Vision4Press platform.
Data correspond to usage on the plateform after 2015. The current usage metrics is available 48-96 hours after online publication and is updated daily on week days.
Initial download of the metrics may take a while.