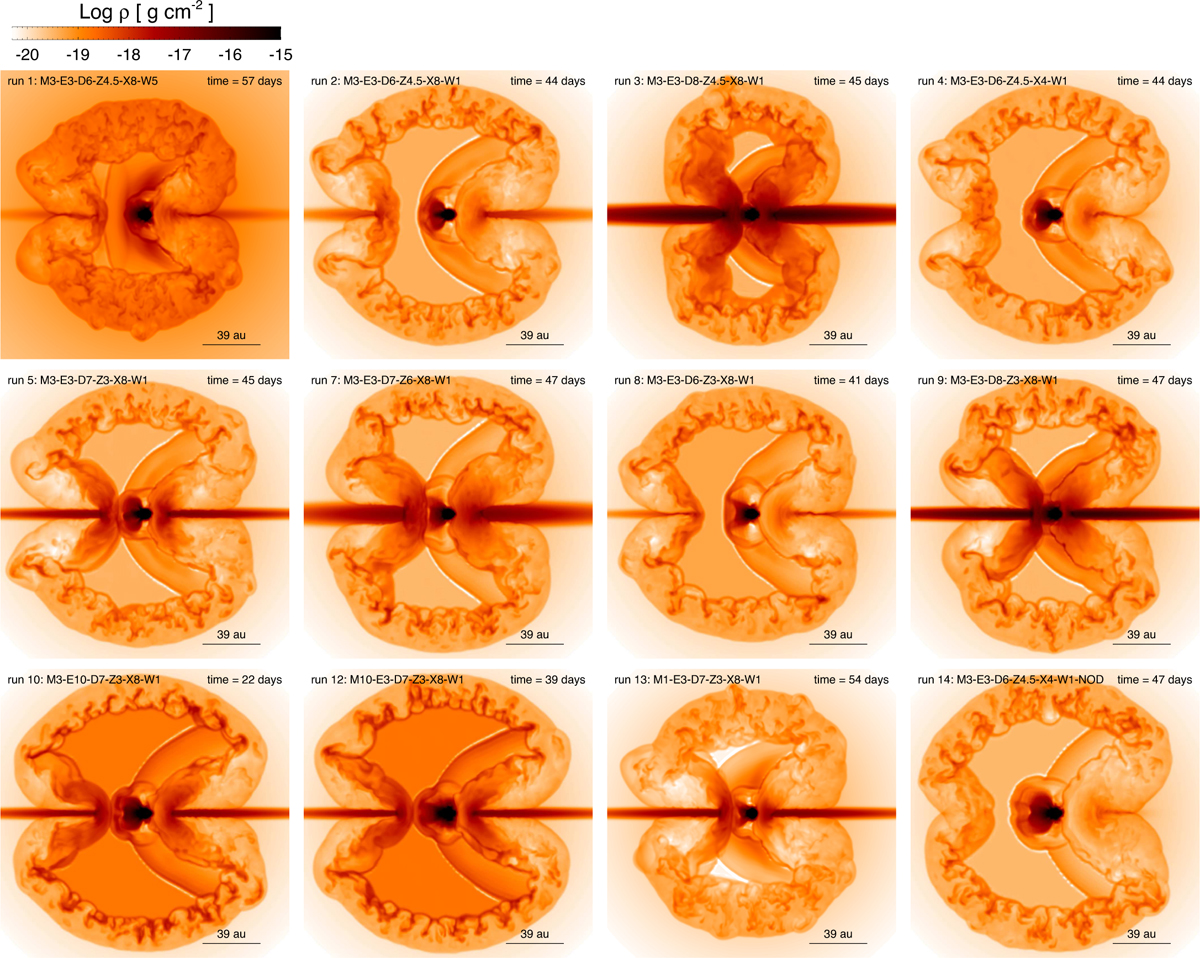
Fig. 4
Download original image
2D cross sections in the (x, z) plane. These display the logarithmic gas density distribution of the nova remnant at the indicated times for most models listed in Table 2 (the model name is shown in the upper left corner of each panel). Runs 6 and 11 are omitted since their morphology is similar to Run 5. The bipolar structure of the blast wave is approximately aligned with the z axis. A scale bar in the lower right corner of each panel indicates the physical length scale. The EDE itself is not visible in models M3-E3-D6-Z4.5-X4-W1 (Run 4) and M3-E3-D6-Z4.5-X4-W1-NOD (Run 14), as they adopt the most compact EDE configuration among all the models considered (see Table 2), and the entire EDE has already been shocked by the time shown.
Current usage metrics show cumulative count of Article Views (full-text article views including HTML views, PDF and ePub downloads, according to the available data) and Abstracts Views on Vision4Press platform.
Data correspond to usage on the plateform after 2015. The current usage metrics is available 48-96 hours after online publication and is updated daily on week days.
Initial download of the metrics may take a while.