Fig. 7
Download original image
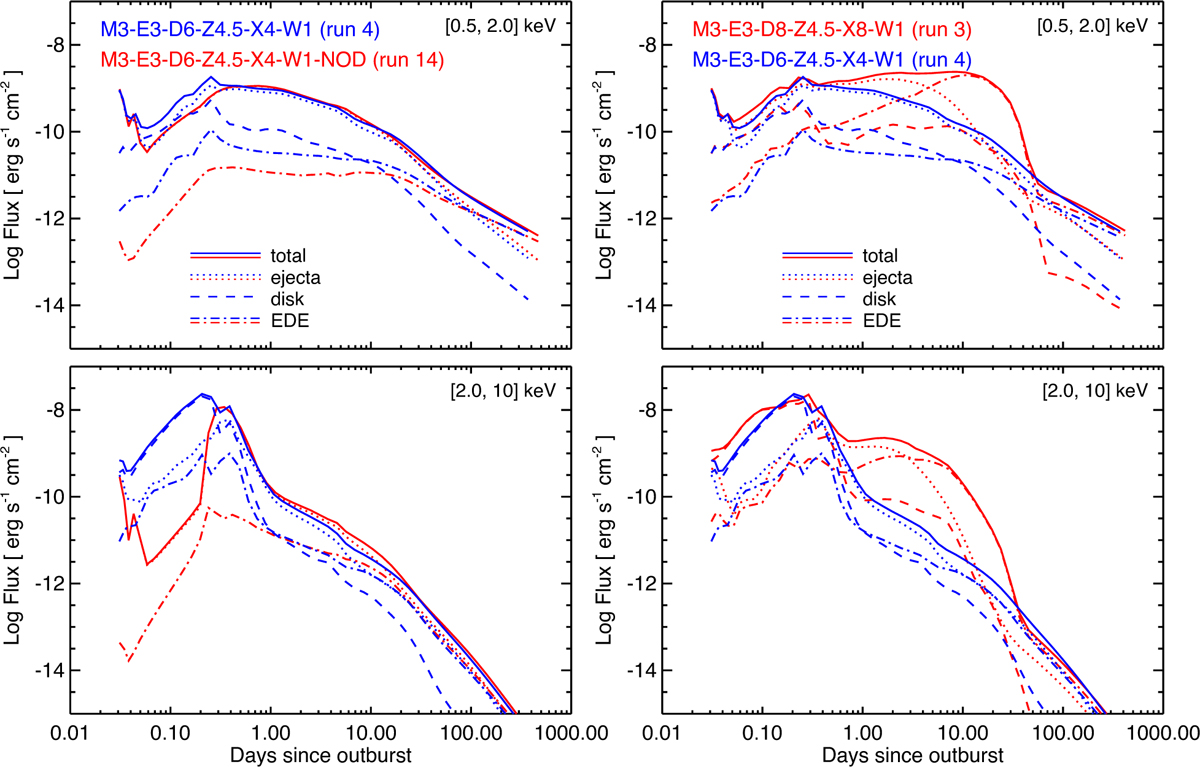
Same as in Fig. 6, but for some selected models in Table 2. Left panels: comparison between two models that differ only by the presence (Run 4, solid blue line) or absence (Run 14, solid red line) of the accretion disk. The dotted, dashed, and dot-dashed lines indicate the contributions to the total emission from the shocked ejecta, the shocked disk material, and the shocked plasma from the CBM (EDE and RG wind), respectively. Right panels: comparison between two models that differ in the geometry and density of the EDE (Runs 3 and 4).
Current usage metrics show cumulative count of Article Views (full-text article views including HTML views, PDF and ePub downloads, according to the available data) and Abstracts Views on Vision4Press platform.
Data correspond to usage on the plateform after 2015. The current usage metrics is available 48-96 hours after online publication and is updated daily on week days.
Initial download of the metrics may take a while.