Fig. 8
Download original image
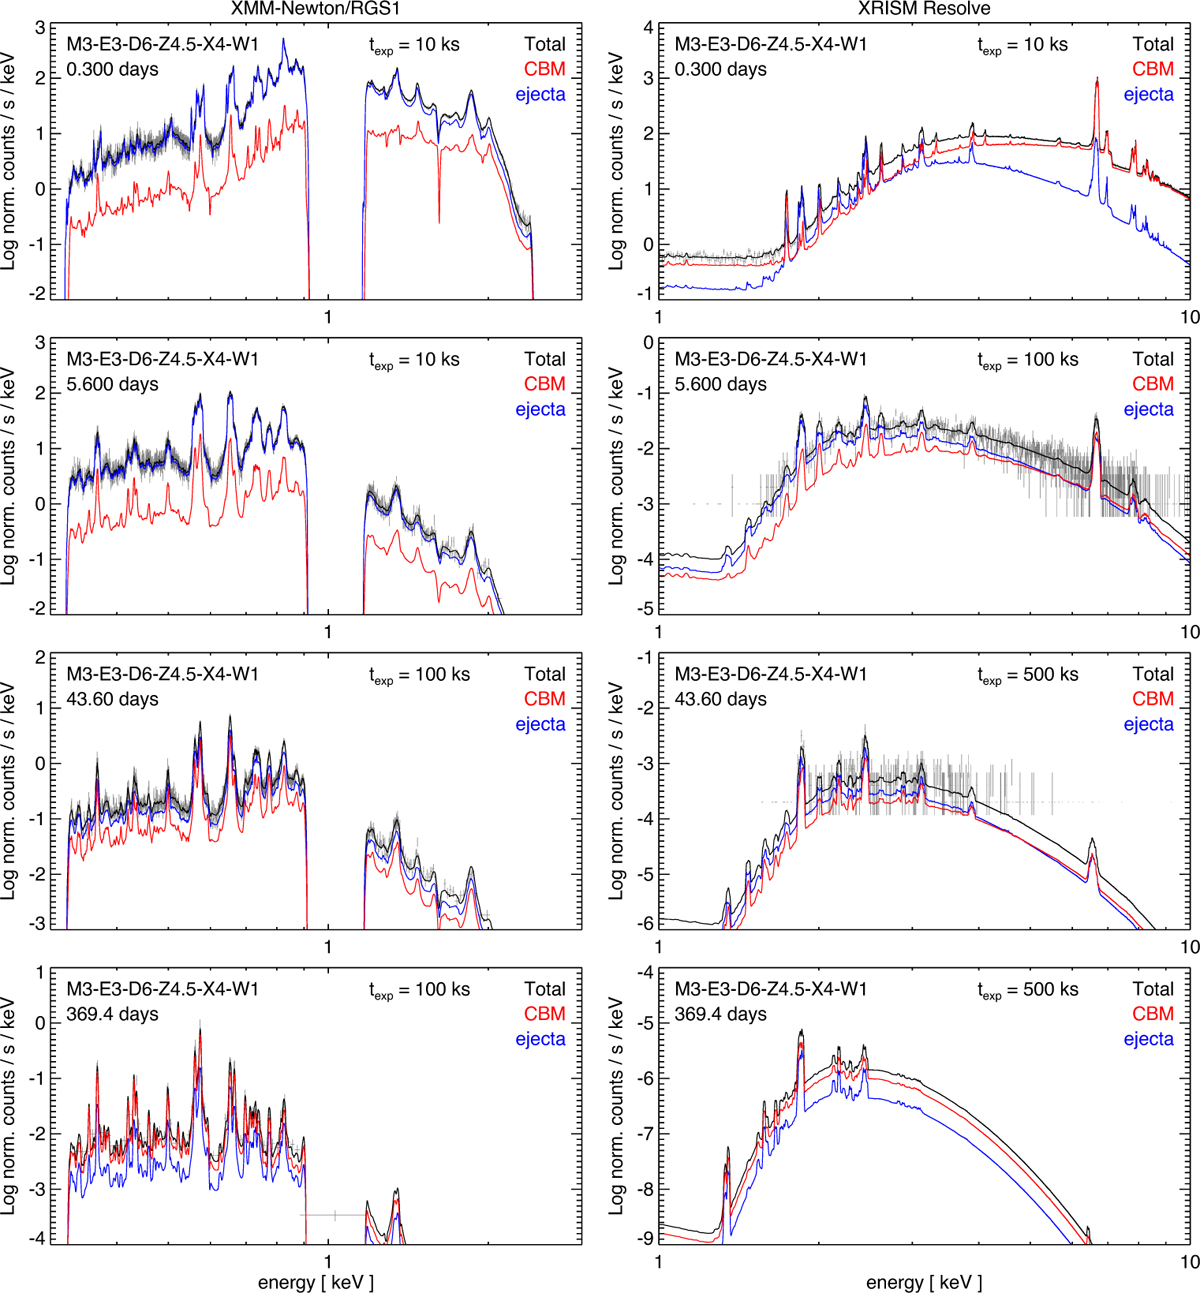
Full XMM-Newton/RGS1 (left panels) and XRISM/Resolve (right panels) synthetic spectra derived from model M3-E3-D6-Z4.5-X4-W1 (Run 4) at the indicated epochs. The simulated observed spectra are shown as gray crosses and were computed assuming an exposure time of 10 ks during the first day (top row) and between 10 and 500 ks at later epochs, depending on the signal-to-noise ratio. Note that the gap in the XMM-Newton/RGS1 data around 1 keV is due to the failure of one of the RGS1 CCDs, which occurred very early in the mission. In addition, the XRISM/Resolve spectrum at day 369 (bottom right panel) shows no detectable signal, even with an exposure time of 500 ks. For comparison, the ideal high-resolution synthetic spectra are overplotted as black lines. The figure also shows the separate contributions from shocked CBM (including disk, EDE, and RG wind; red) and shocked ejecta (blue), highlighting how each component shapes the overall X-ray emission.
Current usage metrics show cumulative count of Article Views (full-text article views including HTML views, PDF and ePub downloads, according to the available data) and Abstracts Views on Vision4Press platform.
Data correspond to usage on the plateform after 2015. The current usage metrics is available 48-96 hours after online publication and is updated daily on week days.
Initial download of the metrics may take a while.