Fig. 9
Download original image
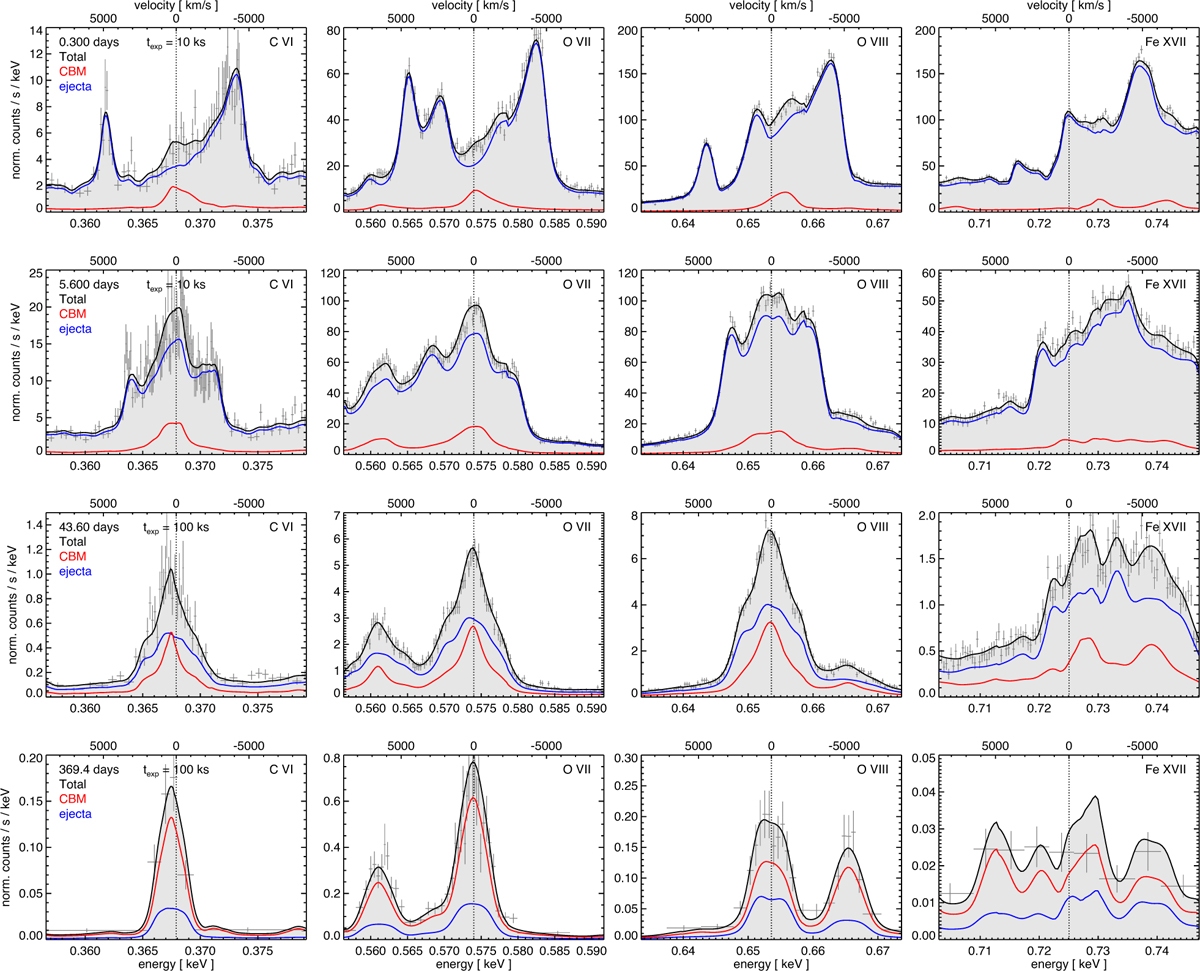
XMM-Newton/RGS1 synthetic spectra derived from model M3-E3-D6-Z4.5-X4-W1 (Run 4) at four representative epochs following the outburst (from top to bottom): approximately seven hours, six days, 44 days, and one year. The figure shows close-up views of selected emission lines: C VI (0.37 keV), O VII (0.57 keV), O VIII (0.65 keV), and Fe XVII (0.72 keV). In each panel, the simulated observed spectra (gray crosses) were computed assuming exposure times of 10 ks during the early phase (top two rows) and 100 ks at later epochs (bottom two rows). Overlaid are the corresponding ideal synthetic spectra (black lines), together with the separate contributions from the shocked CBM (including disk, EDE, and RG wind; red) and the shocked ejecta (blue). The top axis in each panel indicates the Doppler velocity shifts relative to the rest-frame wavelength of the corresponding emission line.
Current usage metrics show cumulative count of Article Views (full-text article views including HTML views, PDF and ePub downloads, according to the available data) and Abstracts Views on Vision4Press platform.
Data correspond to usage on the plateform after 2015. The current usage metrics is available 48-96 hours after online publication and is updated daily on week days.
Initial download of the metrics may take a while.