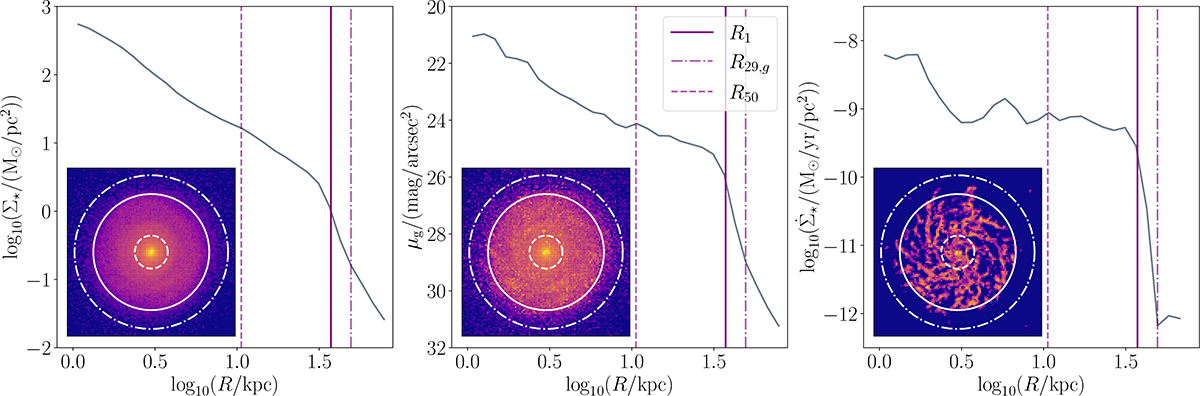
Fig. 1.
Download original image
From left to right, projected density maps and radial profiles of stellar mass, stellar luminosity, and gas star formation rate for a simulated spiral galaxy of stellar mass 3.8 × 10¹⁰ M⊙ selected from the recalibrated simulation. The vertical dashed, solid, and dot-dashed lines mark the positions of R50, R1, and R29, g, respectively. For this star forming galaxy, R1 is a better measure of the size of the galaxy for its proximity to the edge (truncation radius) of the disc. The edge of the disc coincides with a net drop in the star formation rate surface density, the starting hypothesis for the new definition of galaxy size.
Current usage metrics show cumulative count of Article Views (full-text article views including HTML views, PDF and ePub downloads, according to the available data) and Abstracts Views on Vision4Press platform.
Data correspond to usage on the plateform after 2015. The current usage metrics is available 48-96 hours after online publication and is updated daily on week days.
Initial download of the metrics may take a while.