Fig. 2.
Download original image
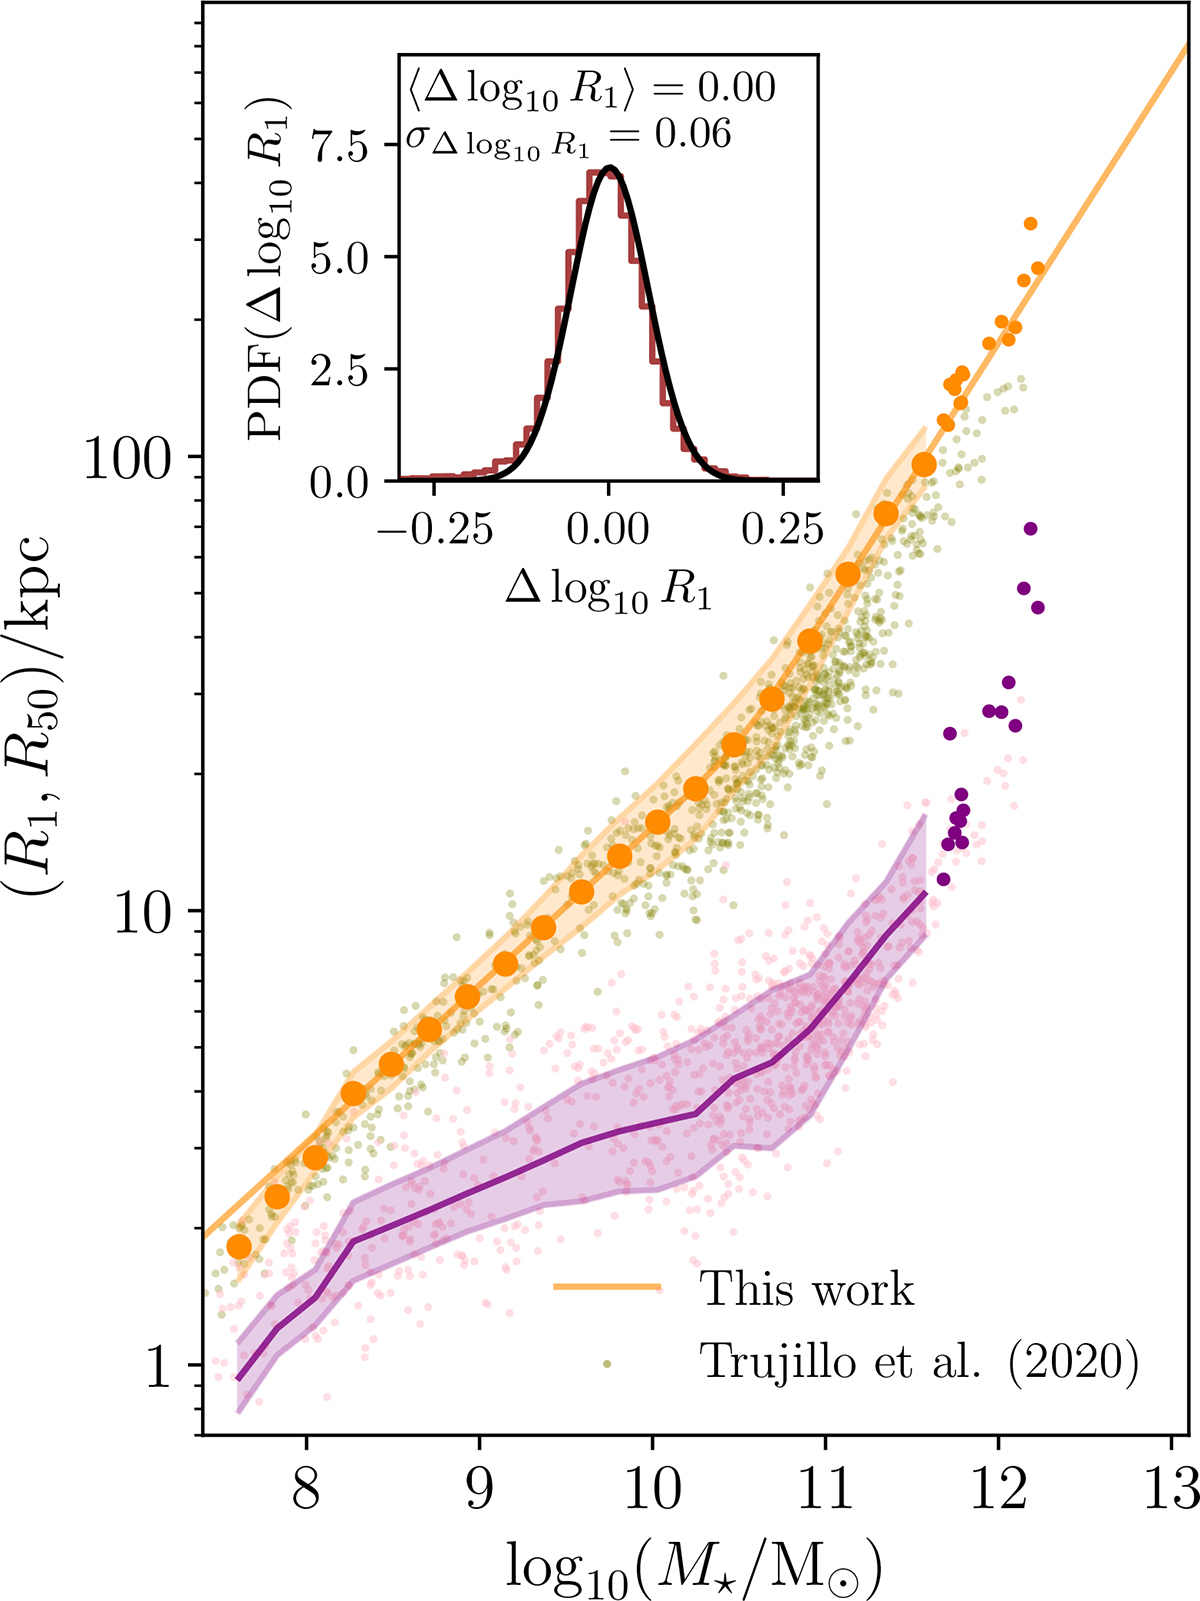
Correlation between R1 and stellar mass for all galaxies in the sample (orange symbols). The median values in each bin are plotted together with the 16% and 84% quantiles (shaded area). For bins with fewer than ten galaxies, single galaxies are plotted as small dots. The orange solid line depicts the double power-law fit for M★ > 108.6 M⊙ (extrapolated below that mass). We show the relation between R50 and stellar mass for all galaxies in the sample in purple. For visual comparison, the galaxies in the sample of Trujillo et al. (2020) are represented with small dots, both R1 and R50. The distribution of the residuals around the best-fit linear relation for all galaxies is shown in the inset. The distribution has been fitted with a Gaussian (solid line) with a dispersion of σΔlog10R1 = 0.06 dex.
Current usage metrics show cumulative count of Article Views (full-text article views including HTML views, PDF and ePub downloads, according to the available data) and Abstracts Views on Vision4Press platform.
Data correspond to usage on the plateform after 2015. The current usage metrics is available 48-96 hours after online publication and is updated daily on week days.
Initial download of the metrics may take a while.