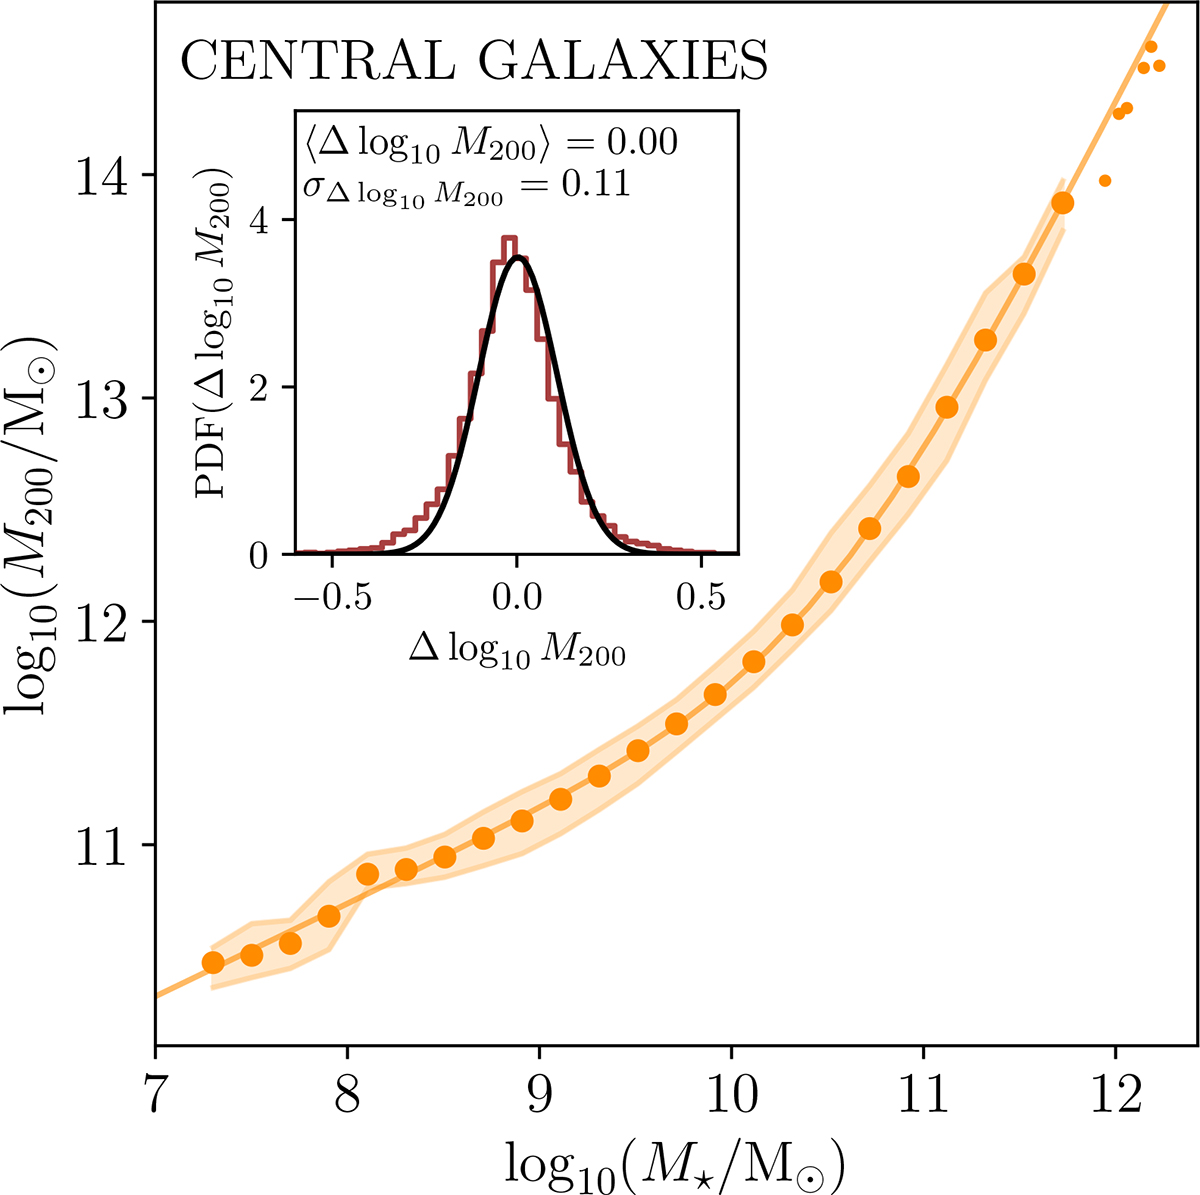
Fig. 4.
Download original image
Correlation between M200 and M★ for central galaxies. Median (dots and solid lines) and 16% and 84% quantiles (shaded areas) are shown. We quote in the legend the average of the scatter for the entire sample of central galaxies and with respect to the analytic fit, together with dispersion around the mean. We plot in the inset the distribution of residuals for the analytic fitting function and all the galaxies in the sample.
Current usage metrics show cumulative count of Article Views (full-text article views including HTML views, PDF and ePub downloads, according to the available data) and Abstracts Views on Vision4Press platform.
Data correspond to usage on the plateform after 2015. The current usage metrics is available 48-96 hours after online publication and is updated daily on week days.
Initial download of the metrics may take a while.