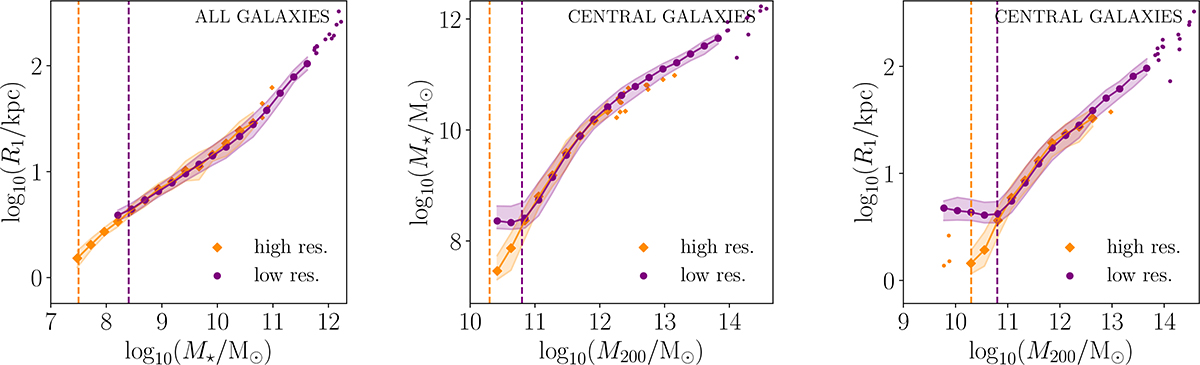
Fig. A.1.
Download original image
Left panel. Relation between size and stellar mass for all galaxies in the two simulations. Dots and diamonds are the median values in bins of halo mass, and the shaded areas indicate the 16% and 84% quantiles. Single dots are for individual galaxies, in bins containing fewer than ten galaxies. The vertical lines mark the minimum masses considered for the two simulations in the computation of the analytic fits. Middle panel. Relation between stellar mass, M★, and halo mass, M200, for all central galaxies in the two simulations. Symbols are as in the left panel. The vertical lines mark the lower halo mass limit of the samples extracted from the two simulations and employed in the computation of the R1 − R200 relation. Right panel. Same as the middle panel, but for the R1 − M200 relation.
Current usage metrics show cumulative count of Article Views (full-text article views including HTML views, PDF and ePub downloads, according to the available data) and Abstracts Views on Vision4Press platform.
Data correspond to usage on the plateform after 2015. The current usage metrics is available 48-96 hours after online publication and is updated daily on week days.
Initial download of the metrics may take a while.