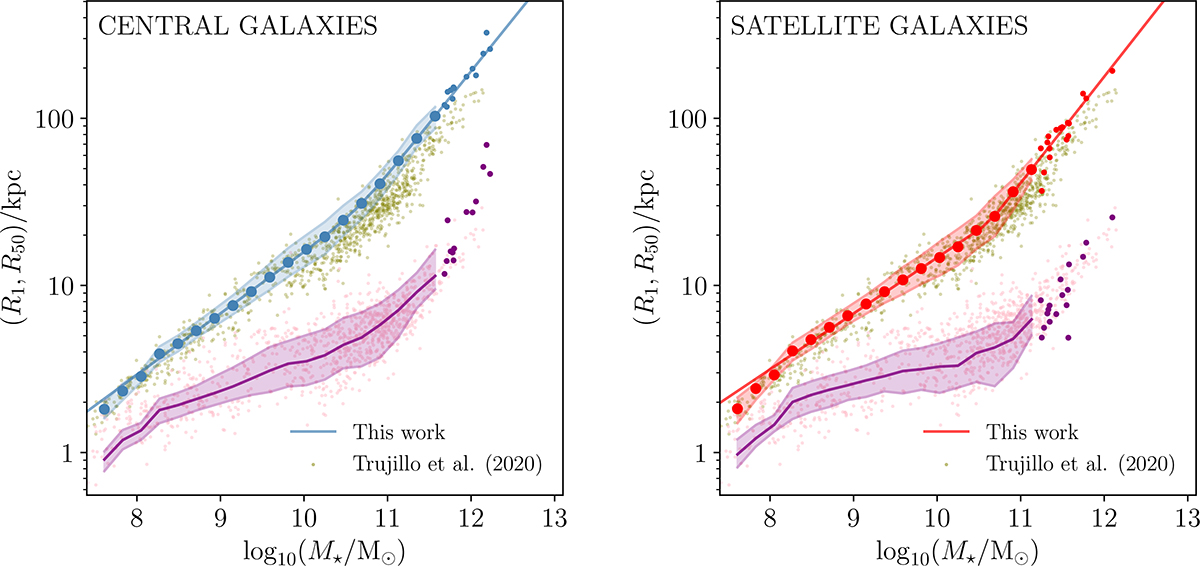
Fig. B.1.
Download original image
Correlation between R1 and stellar mass for central (left panel) and satellite (right panel) galaxies in the sample. The median values for each bin are plotted together with the 16% and 84% quantiles (shaded area). For bins with fewer than ten galaxies, single values are plotted. Both fits to the data are for stellar masses M★ > 108.5 M⊙. For comparison, we plot the relation for R50 in purple.
Current usage metrics show cumulative count of Article Views (full-text article views including HTML views, PDF and ePub downloads, according to the available data) and Abstracts Views on Vision4Press platform.
Data correspond to usage on the plateform after 2015. The current usage metrics is available 48-96 hours after online publication and is updated daily on week days.
Initial download of the metrics may take a while.