Fig. 1.
Download original image
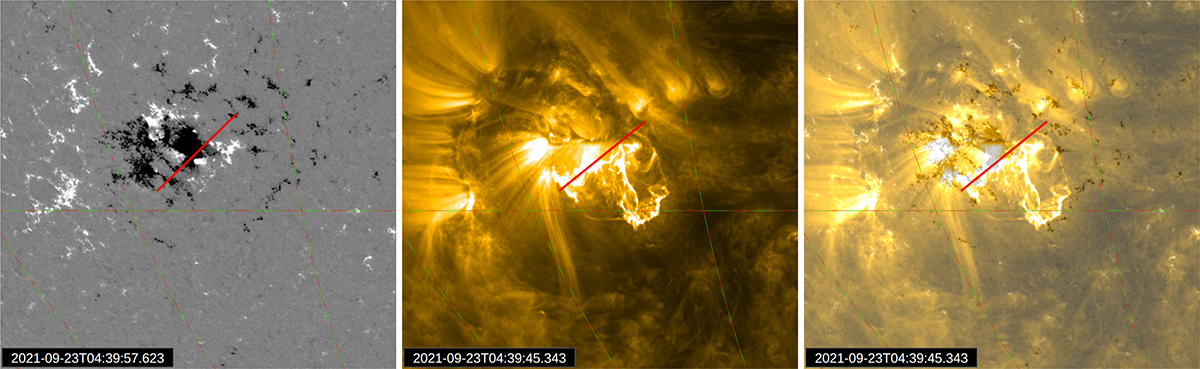
Configuration of the solar atmosphere during the CME eruption for SOL2021-09-23T04:39:45. The left panel represents the HMI magnetogram, which is saturated between ±1000 G. The middle panel represents the AIA 171 Å image, and the right panel shows the AIA image overlaid on the magnetogram. The red line shows the approximate polarity-inversion line. The figures were created with JHelioviewer.
Current usage metrics show cumulative count of Article Views (full-text article views including HTML views, PDF and ePub downloads, according to the available data) and Abstracts Views on Vision4Press platform.
Data correspond to usage on the plateform after 2015. The current usage metrics is available 48-96 hours after online publication and is updated daily on week days.
Initial download of the metrics may take a while.