Fig. A.1.
Download original image
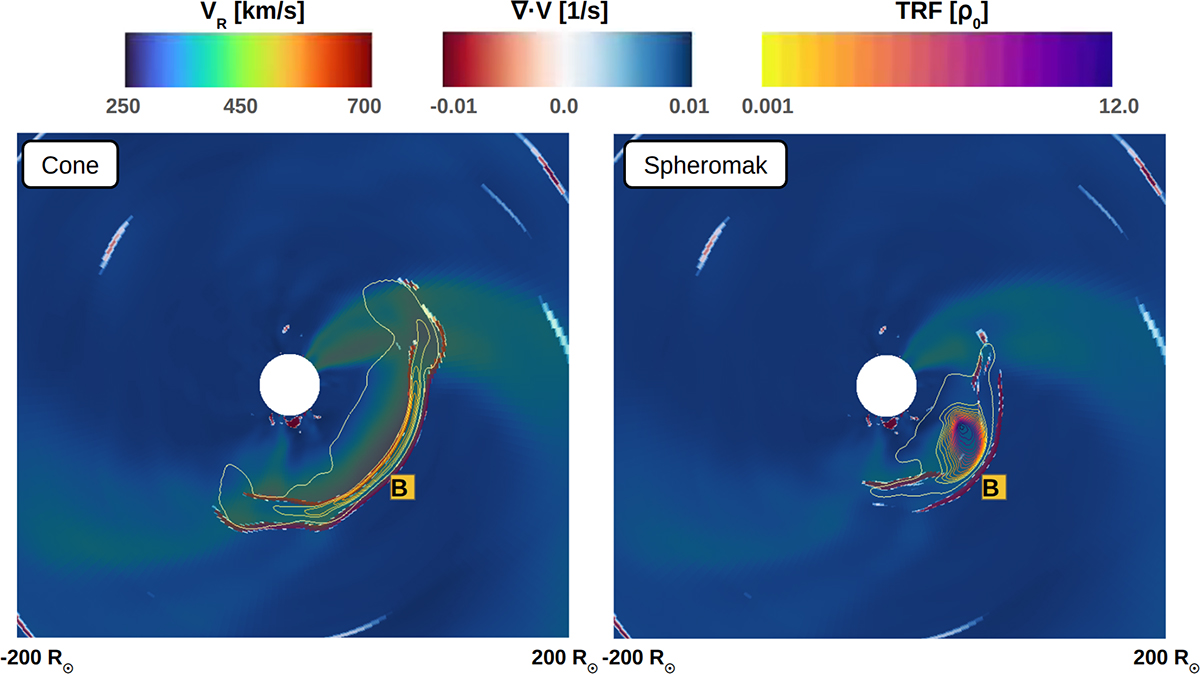
Equatorial planes in the 3D dynamic heliosphere simulations with the cone (left) and spheromak (right) CMEs. The radial velocity and velocity divergence are plotted in the background. The contour of the CME tracing function, TRF, is overplotted. The snapshot corresponds to the observed arrival of the shock at BepiColombo. The BepiColombo location is indicated on the figure with ‘B’.
Current usage metrics show cumulative count of Article Views (full-text article views including HTML views, PDF and ePub downloads, according to the available data) and Abstracts Views on Vision4Press platform.
Data correspond to usage on the plateform after 2015. The current usage metrics is available 48-96 hours after online publication and is updated daily on week days.
Initial download of the metrics may take a while.