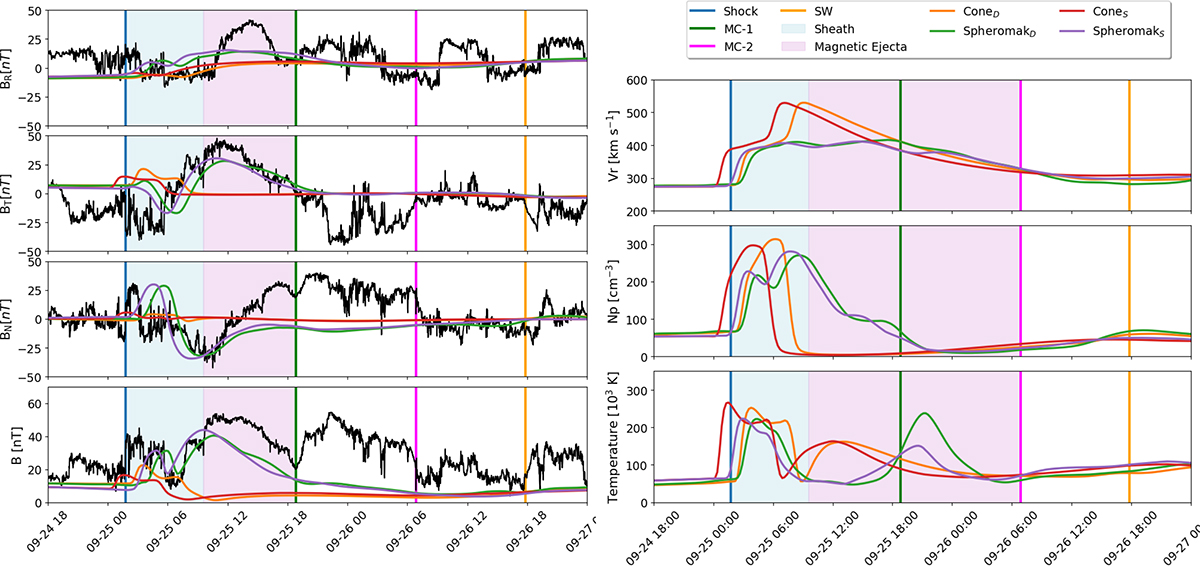
Fig. A.2.
Download original image
Timeseries of the magnetic field (left) and plasma quantities (right) at BepiColombo. The blue vertical line indicates the shock, the green vertical line corresponds to the end of the magnetic cloud of the CME, the magenta line corresponds to the end of the second magnetic cloud, and the orange vertical line shows the end of a part of the solar wind following the CME. The blue and pink shaded regions indicate the sheath and the magnetic ejecta regions. The dynamic solar wind simulations, using the cone and spheromak CME models, are depicted in orange and green, respectively. Steady solar wind simulations with cone and spheromak CMEs are given in red and purple colours. The BepiColombo measurements are not plotted for plasma quantities, since these are not available from the instrument.
Current usage metrics show cumulative count of Article Views (full-text article views including HTML views, PDF and ePub downloads, according to the available data) and Abstracts Views on Vision4Press platform.
Data correspond to usage on the plateform after 2015. The current usage metrics is available 48-96 hours after online publication and is updated daily on week days.
Initial download of the metrics may take a while.